Inflation barely budged in April as tariffs President Donald Trump implemented in the early part of the month had yet to show up in consumer prices, the Commerce Department reported Friday.
The personal consumption expenditures price index, the Federal Reserve’s key inflation measure, increased just 0.1% for the month, putting the annual inflation rate at 2.1%. The monthly reading was in line with the Dow Jones consensus forecast while the annual level was 0.1 percentage point lower.
Excluding food and energy, the core reading that tends to get even greater focus from Fed policymakers showed readings of 0.1% and 2.5%, against respective estimates of 0.1% and 2.6%.
Consumer spending, though, slowed sharply for the month, posting just a 0.2% increase, in line with the consensus but slower than the 0.7% rate in March. A more cautious consumer mood also was reflected in the personal savings rate, which jumped to 4.9%, up from 0.6 percentage point in March to the highest level in nearly a year.
Personal income surged 0.8%, a slight increase from the prior month but well ahead of the forecast for 0.3%.
Markets showed little reaction to the news, with stock futures continuing to point lower and Treasury yields mixed.
People shop at a grocery store in Brooklyn on May 13, 2025 in New York City.
Spencer Platt | Getty Images
Trump has been pushing the Fed to lower its key interest rate as inflation has continued to gravitate back to the central bank’s 2% target. However, policymakers have been hesitant to move as they await the longer-term impacts of the president’s trade policy.
On Thursday, Trump and Fed Chair Jerome Powell held their first face-to-face meeting since the president started his second term. However, a Fed statement indicated the future path of monetary policy was not discussed and stressed that decisions would be made free of political considerations.
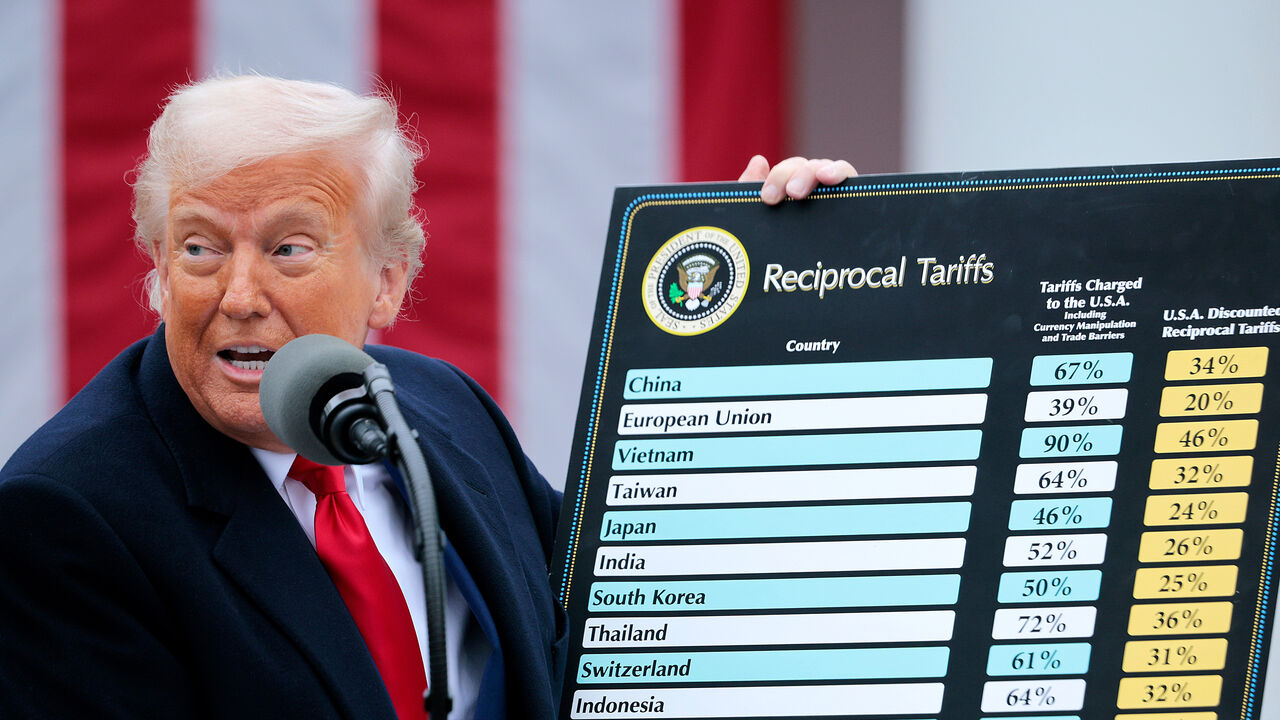
Trump slapped across-the-board 10% duties on all U.S. imports, part of an effort to even out a trading landscape in which the U.S. ran a record $140.5 billion deficit in March. In addition to the general tariffs, Trump launched selective reciprocal tariffs much higher than the 10% general charge.
Since then, though, Trump has backed off the more severe tariffs in favor of a 90-day negotiating period with the affected countries. Earlier this week, an international court struck down the tariffs, saying Trump exceeded his authority and didn’t prove that national security was threatened by the trade issues.
Then in the latest installment of the drama, an appeals court allowed a White House effort for a temporary stay of the order from the U.S. Court of International Trade.
Economists worry that tariffs could spark another round of inflation, though the historical record shows that their impact is often minimal.
At their policy meeting earlier this month, Fed officials also expressed worry about potential tariff inflation, particularly at a time when concerns are rising about the labor market. Higher prices and slower economic growth can yield stagflation, a phenomenon the U.S. hasn’t seen since the early 1980s.

 Accounting1 week ago
 Personal Finance1 week ago
 Accounting1 week ago
 Finance1 week ago
 Economics1 week ago
 Economics1 week ago
 Economics1 week ago
 Personal Finance1 week ago


