Connect with us

Economics

Renewable Energy Tech and Advancements in Storage Solutions

Published

on

Renewable Energy Tech and Advancements in Storage Solutions

The global push for sustainable energy has spotlighted renewable energy technologies and advanced storage solutions. These innovations are pivotal in reducing reliance on fossil fuels, mitigating climate change, and ensuring a reliable energy supply. From solar panels and wind turbines to cutting-edge battery storage systems, the renewable energy sector has made remarkable progress. This article explores the latest advancements in renewable energy technologies and the evolution of energy storage solutions.


Advances in Renewable Energy Technologies

  1. Solar Power Innovations
    Solar energy remains a cornerstone of the renewable energy sector. Advances in photovoltaic (PV) technology, such as bifacial solar panels, have significantly increased efficiency. These panels capture sunlight from both sides, generating more power from the same area. Additionally, thin-film solar cells, made from lightweight and flexible materials, are expanding the applications of solar power in urban areas and portable devices.
  2. Wind Energy Developments
    Wind turbines have become taller and more efficient, capturing wind at higher altitudes where it is stronger and more consistent. Offshore wind farms are also gaining traction, with floating wind turbines enabling installations in deeper waters. These advancements increase energy output while reducing land use and visual impact.
  3. Hydropower and Marine Energy
    Hydropower is evolving to include smaller, modular units that can be deployed in remote areas with minimal environmental disruption. Marine energy, including wave and tidal power, is also gaining momentum. These technologies harness the consistent energy of ocean currents, providing a reliable renewable energy source.

The Role of Advanced Energy Storage Solutions

Renewable energy sources like solar and wind are inherently intermittent, producing energy only when the sun shines or the wind blows. Energy storage solutions bridge this gap, ensuring a stable and reliable energy supply.

  1. Lithium-Ion Batteries
    Lithium-ion batteries dominate the energy storage landscape due to their high energy density and declining costs. They are widely used in electric vehicles (EVs), residential solar systems, and grid-scale storage solutions. Innovations like solid-state batteries, which replace liquid electrolytes with solid materials, promise enhanced safety and efficiency.
  2. Flow Batteries
    Flow batteries are gaining attention for their scalability and long-duration storage capabilities. These batteries use liquid electrolytes stored in external tanks, allowing for easy scaling to meet energy demands. They are ideal for grid applications and large-scale renewable energy projects.
  3. Hydrogen Energy Storage
    Hydrogen is emerging as a versatile energy storage medium. Surplus renewable energy can be used to produce green hydrogen through electrolysis, which can then be stored and converted back into electricity or used as fuel. Hydrogen’s potential extends to industrial applications, heavy transport, and long-term energy storage.
  4. Thermal Energy Storage
    Thermal energy storage systems store heat or cold for later use, often in buildings or industrial processes. Concentrated solar power (CSP) plants use molten salt to store thermal energy, enabling electricity generation even after sunset.

Impact of Smart Grids and IoT

The integration of renewable energy and storage solutions is further enhanced by smart grid technology. Smart grids use IoT devices and AI-driven analytics to manage energy distribution efficiently. They enable real-time monitoring, demand response, and integration of distributed energy resources, ensuring optimal utilization of renewable energy and storage systems.


Challenges and Future Outlook

While renewable energy and storage technologies have made significant strides, challenges remain. High upfront costs, material shortages, and recycling concerns must be addressed for widespread adoption. However, continuous innovation, policy support, and global collaboration are driving the sector forward.

Emerging technologies like perovskite solar cells, next-generation batteries, and artificial intelligence-driven energy management systems hold the promise of a cleaner, more sustainable energy future.


Conclusion

Renewable energy technologies and advanced storage solutions are transforming the global energy landscape. From efficient solar panels and wind turbines to scalable batteries and hydrogen storage, these innovations are key to achieving energy independence and combating climate change. By investing in these technologies and integrating them with smart energy systems, we can create a resilient, sustainable energy infrastructure for generations to come.

Economics

U.S. Inflation Outlook for 2027

Published

on

U.S. Inflation Outlook for 2027

A Deep Analysis of Prices, Monetary Policy and Economic Risks

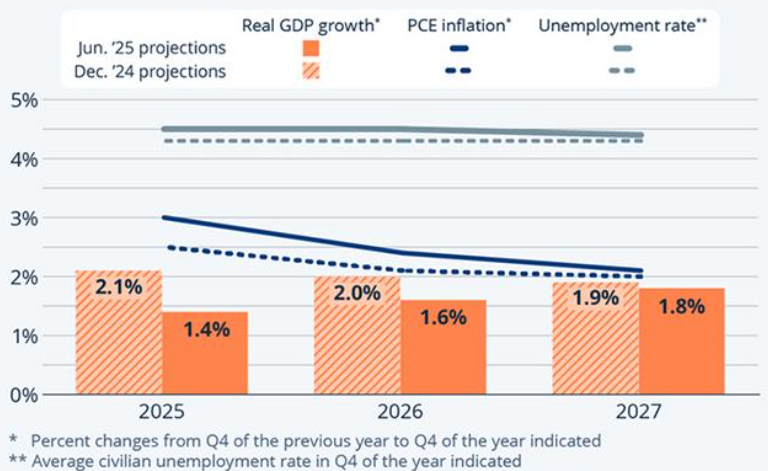
The U.S. inflation outlook for 2027 points toward substantial disinflation compared with the elevated price pressures experienced during 2026, but the path back to the Federal Reserve’s 2 percent objective is unlikely to be completely smooth. The most important official forecasts currently point toward inflation moving closer to target during 2027 as tariff-related price pressures fade, energy markets stabilize, monetary policy remains restrictive enough to moderate demand, and labor-market pressures become more balanced. The Federal Reserve’s June 2026 Summary of Economic Projections places median PCE inflation at 2.3 percent in 2027, compared with 3.6 percent in 2026, while its longer-run projection is 2 percent.

https://images.openai.com/static-rsc-4/_tPsUZgq8cDk322ilkmnqbO78aPd78yCJzTvda2gMDFTF0C7Gz8NKTMmWQNDCQIiL-BXvCY8Chbslrabz7DBtiA4R9BieNb0yLoAYcFqC3fwUyBwqnucA7WBZFg4HPHugls_qNun_pdJpKiFlEpsrTJ1EH53sqdEEyxnFi_vh581XVTT8cgF2C_fSXQb32XU?purpose=fullsize

https://images.openai.com/static-rsc-4/bA8LqRY4P0B7ibNOak8m01QgAneAkLi76tFKyEzBgcIcHwkncZgQBghmCLPquY1wFzCIQyELGWQ3Zy-a9hVv0UaMIzDN4XUMeWdDOFr4ikpLOsGB_ths-N-Xu4FmjWOYnBgVQfVnJ_s07hR-5XodQRscyt0yLXE5NkaBNN0Kkz3Q97pDI36Zk2iqvojJLsBk?purpose=fullsize

https://images.openai.com/static-rsc-4/HbawSdf1nH5l18B7jHiysqbDWuRmLvFBW03P4cRyeYlOUT3popuM-NSAEsgOKKZSLpFgMFXJ2OVmvMWZmRXNasnnb_pwNqq7mhm4uYzydQqTSbp3yT3Ff4JG_DRLe3JrtZ-zvhlLxVh1BWgnmZebtKQUujz4RK31RRdsTUmp8iuYDW9EBC2gfBoRmCFmFjau?purpose=fullsize

The International Monetary Fund (IMF) presents a broadly similar but somewhat more cautious picture. Its April 2026 World Economic Outlook projected U.S. consumer-price inflation at 2.1 percent in 2027, following 3.2 percent in 2026. The IMF’s April 2026 U.S. Article IV assessment also expects core PCE inflation to return to approximately 2 percent during the first half of 2027, although it identifies energy prices and other upside risks as important uncertainties.

The World Bank provides an important global context rather than a directly comparable U.S.-specific inflation target forecast. Its June 2026 Global Economic Prospects expects global conditions to improve during 2027–28 as energy supplies recover, inflation and uncertainty recede, and financial conditions ease. However, the institution also emphasizes that energy shocks, geopolitical tensions and commodity-market disruptions could continue generating inflationary pressure.

Federal Reserve Forecast: Inflation Moves Toward 2 Percent

The Federal Reserve’s projections provide perhaps the clearest benchmark for assessing the 2027 U.S. inflation forecast. In its June 2026 projections, the median forecast for PCE inflation is 2.3 percent in 2027, compared with 3.6 percent in 2026 and 2.0 percent in 2028. The central tendency for 2027 ranges from 2.2 percent to 2.5 percent, while the full participant range extends from 1.9 percent to 2.8 percent.

That forecast suggests that the Federal Reserve expects most of the inflation problem to be resolved during 2027 rather than immediately. Importantly, PCE inflation is the Fed’s preferred broad measure of consumer inflation, meaning its 2.3 percent projection should not be interpreted as a direct forecast for the Consumer Price Index. CPI and PCE can differ because they use different methodologies and expenditure weights.

The Fed’s forecast also implies an important monetary-policy transition. Its June projections place the median federal funds rate at 3.6 percent at the end of 2027, down from 3.8 percent at the end of 2026. This combination—falling inflation and gradually lower interest rates—would be consistent with a soft-landing environment in which monetary policy becomes less restrictive as price pressures moderate.

IMF Forecast: Core Inflation Could Reach 2 Percent in Early 2027

The IMF’s 2026 assessment provides an especially useful explanation for why inflation could decline during 2027. According to the IMF’s U.S. Article IV report, tariff-related inflationary effects are expected to diminish, allowing core PCE inflation to fall back to approximately 2 percent during the first half of 2027. The IMF nevertheless warns that headline inflation could remain somewhat higher because of movements in global oil prices.

This distinction between core and headline inflation is critical. Core inflation excludes food and energy because those categories can fluctuate sharply, while headline inflation includes them. If oil prices rise because of geopolitical disruptions, headline inflation could temporarily remain above the underlying trend even if domestic wage growth, rents and service prices are moderating.

The IMF’s April 2026 data also forecast U.S. average consumer-price inflation at 3.2 percent in 2026 and 2.1 percent in 2027. In other words, the IMF sees inflation moving very close to the Federal Reserve’s 2 percent objective by 2027.

World Bank Perspective: Energy Prices Remain a Major Risk

The World Bank’s analysis adds an important external dimension to the U.S. inflation outlook for 2027. Its June 2026 Global Economic Prospects argues that advanced-economy growth is being affected by higher energy prices, inflation, constrained energy supplies and tighter monetary conditions. At the same time, the World Bank expects energy supplies to recover over 2027–28, with inflation and uncertainty receding and financial conditions gradually easing.

For the United States, this means the inflation trajectory will depend not only on domestic demand but also on developments in global commodity markets. The U.S. economy is relatively large and diversified, but changes in crude oil, natural gas, transportation and other commodity prices can still affect household purchasing power and business costs.

The World Bank also highlights geopolitical risks. Its June outlook identifies prolonged disruptions to energy markets as a potential source of higher inflation and weaker global growth. Consequently, the most plausible 2027 scenario is not necessarily one of perfectly stable 2 percent inflation, but rather inflation that averages near target while remaining vulnerable to temporary external shocks.

Tariffs and the 2027 Inflation Path

One of the most important factors separating the 2027 outlook from the inflation environment of 2025–26 is the expected fading of tariff-related price effects. The Federal Reserve reported that inflation had moved higher as tariff increases pushed up prices for some consumer goods. The IMF similarly concluded that the inflationary impact of tariffs should wane as their pass-through to consumer prices is completed.

This creates a potentially favorable base effect for 2027. If tariffs raise the price level during one period but do not continue accelerating afterward, their contribution to the annual inflation rate can diminish. That does not mean consumers necessarily see prices return to earlier levels; rather, it means prices may increase more slowly.

This distinction is essential for households and businesses. Disinflation does not mean deflation. A decline from 3.5 percent inflation to 2 percent inflation means prices are still rising, simply at a slower pace. Consequently, the cumulative increase in the price level since the pandemic will remain an important economic issue even after the annual inflation rate approaches the Federal Reserve’s target.

Labor Markets and Services Inflation

Another critical variable for 2027 will be services inflation. Goods prices can respond relatively quickly to supply-chain normalization and changes in trade policy, whereas services prices are often more closely linked to wages, housing costs, insurance, healthcare and domestic demand.

The IMF expects U.S. employment growth to slow compared with the unusually strong pace of the years before the pandemic, while the unemployment rate is expected to remain near 4 percent in 2026–27. A labor market that remains healthy but less overheated would be favorable for disinflation because wage pressures could moderate without producing a severe employment contraction.

This is the foundation of the soft-landing scenario. If productivity continues improving while wage growth moderates gradually, businesses may be able to absorb higher labor costs without passing the entire increase to consumers. Conversely, renewed labor shortages or unexpectedly strong demand could make service-sector inflation more persistent.

The Main Risks to the 2027 Inflation Forecast

Although the baseline outlook is favorable, the official forecasts emphasize considerable uncertainty. The Federal Reserve’s historical forecast-error analysis indicates a wide potential range around inflation projections. Its estimated historical error range for total consumer prices in 2027 is approximately ±1.6 percentage points, illustrating why point forecasts should not be treated as precise predictions.

The major upside risks include another energy shock, renewed geopolitical conflict, stronger-than-expected consumer demand, persistent housing costs, renewed wage pressure and additional tariff increases. The IMF specifically identifies global energy prices as an upside inflation risk for the United States.

There are also downside risks. A sharper-than-expected slowdown in U.S. economic activity, weaker global demand, falling commodity prices or faster productivity growth could push inflation below the Federal Reserve’s target. The World Bank’s expectation that global inflation and uncertainty will recede during 2027–28 supports the possibility of a relatively benign external inflation environment.

2027 U.S. Inflation Forecast: Overall Assessment

Taken together, the Federal Reserve, IMF and World Bank outlooks point toward a significant improvement in U.S. inflation during 2027. The Fed’s 2.3 percent PCE inflation projection, the IMF’s 2.1 percent consumer-price forecast and its expectation that core PCE could reach approximately 2 percent in the first half of the year all indicate that inflation is likely to move substantially closer to the Federal Reserve’s long-run objective.

The most likely 2027 environment will be moderate inflation near, but not necessarily exactly at, 2 percent, combined with gradually less restrictive monetary policy. The biggest threat to this outlook is an external energy or geopolitical shock rather than a broad-based reacceleration of domestic inflation. The central question for investors, businesses and households will therefore shift from whether inflation is declining to whether it can remain sustainably close to target.

Ultimately, 2027 could represent an important transition point for the U.S. economy. If tariff effects fade, labor-market conditions remain balanced, productivity continues improving and global energy markets stabilize, the United States could enter a period of relatively stable prices and lower interest rates. If those assumptions fail, however, inflation could remain above target and force the Federal Reserve to maintain restrictive monetary policy for longer.

Key 2027 Inflation Indicators at a Glance

Institution2026 Outlook2027 OutlookKey Message
Federal Reserve3.6% PCE2.3% PCEInflation moves substantially closer to 2%
IMF3.2% consumer prices2.1% consumer pricesNear-target inflation by 2027
IMF — Core PCEElevatedAround 2% by H1 2027Core inflation normalizes
World BankInflation elevated by energy shockInflation expected to recede globallyEnergy normalization supports disinflation

Source note: The measures are not perfectly interchangeable. The Federal Reserve’s projection uses PCE inflation, while the IMF’s 2.1 percent figure is based on U.S. consumer prices. The World Bank’s contribution is primarily its global macroeconomic and commodity-market assessment.


For more reading, visit

Continue Reading

Economics

U.S.- Canada Trade Talks Collapse; Carney Says Retaliatory Tariffs Begin September 8

Published

on

U.S.- Canada Trade Talks Collapse; Carney Says Retaliatory Tariffs Begin September 8

Trade negotiations between the United States and Canada collapsed this week, with Canadian Prime Minister Mark Carney announcing that retaliatory tariffs on U.S. goods will take effect September 8, 2026. The breakdown follows the Trump administration’s imposition of 50% tariffs on certain Canadian goods, according to reporting from CNBC and the Washington Post.

What Happened

CNBC reported the collapse of talks as part of its ongoing business news coverage on August 22, 2026, noting the story as one of the week’s most significant developments for cross-border trade. The Washington Post’s business desk, in coverage also published August 22-23, quoted Carney characterizing President Trump’s 50% tariffs as “a miscalculation,” and confirmed the September 8 date for Canada’s retaliatory measures.

As of this writing, specific details on which categories of U.S. goods will be subject to Canadian retaliatory tariffs have not been fully reported. This article will be updated with additional specifics as they become available from primary government sources.

Why This Matters for Markets and Consumers

Trade disputes between the U.S. and its largest trading partners tend to have ripple effects across supply chains, consumer prices, and specific industry sectors with cross-border exposure. A Washington Post analysis accompanying the coverage noted that other countries unhappy with existing U.S. trade arrangements are likely watching the U.S.-Canada breakdown closely, suggesting the dispute could have implications beyond the immediate bilateral relationship.

Broader Context: A Volatile Week for Cross-Border and Fiscal News

The trade breakdown arrived during an already turbulent week for U.S. economic news. The same week saw the national debt cross $40 trillion for the first time, a sharp rise in Treasury bond market volatility, and the Treasury Department doubling the size of its debt buyback program. Whether the trade dispute has any direct connection to these fiscal and monetary developments has not been established in current reporting, but the concentration of major economic stories in the same week has drawn attention from market commentators tracking overall macroeconomic risk.

How This Fits the Broader Trade Policy Pattern

The U.S.-Canada breakdown is not occurring in isolation. Trade policy has been an active area of U.S. economic policymaking throughout 2026, with tariff actions and negotiations affecting multiple trading partners over the course of the year. Canada has historically been among the United States’ largest trading partners by total trade volume, meaning a prolonged dispute carries more direct economic exposure for both economies than a similar breakdown with a smaller trading partner would.

Industries with integrated North American supply chains — including automotive manufacturing, agriculture, and energy — have historically been among the most exposed to U.S.-Canada trade friction, given the degree to which components and raw materials cross the border multiple times during production. Businesses in these sectors should treat the September 8 deadline as a planning point regardless of whether it ultimately takes effect as announced.

What We Don’t Yet Know

Several material details remain unconfirmed or unreported as of this writing:

– The specific list of U.S. product categories subject to Canadian retaliatory tariffs
– Whether any further negotiations are scheduled between the September 8 deadline and the present
– Potential exemptions for critical supply chains, such as energy or auto parts, which have historically received special treatment in prior U.S.-Canada trade disputes

What to Watch Next

Businesses with cross-border exposure to Canadian suppliers or customers should monitor official statements from the U.S. Trade Representative’s office and Canada’s Department of Global Affairs for detailed tariff schedules ahead of the September 8 implementation date. Given the fluid nature of trade negotiations, a resumption of talks or a modified agreement before that date remains possible and would supersede current retaliatory tariff plans.

Continue Reading

Economics

U.S. National Debt Surpasses $40 Trillion for the First Time: What It Means for the Economy

Published

on

US Debt is now 40 trillions

The U.S. gross national debt crossed $40 trillion for the first time this week, according to Treasury Department data reported by NPR on August 20, 2026. The milestone caps a period of rapid fiscal expansion: the debt has doubled since 2017, and the federal government now spends more than $1 trillion a year just servicing interest on what it owes.

Why the Debt Load Is Accelerating

The debt has not grown at a steady pace. Instead, a combination of pandemic-era spending, tax policy changes, and elevated interest rates has compounded the federal government’s borrowing costs. As older Treasury bonds issued at lower rates mature, they are being refinanced at today’s higher prevailing rates, which pushes up the government’s annual interest bill even without any new borrowing.

That interest bill is no longer a minor line item. At more than $1 trillion annually, debt servicing now competes directly with discretionary spending on defense, infrastructure, and social programs. Economists watching the trend note that this dynamic can become self-reinforcing: higher interest costs widen the deficit, which requires more borrowing, which in turn raises future interest costs.

Bond Market Reaction

The debt milestone arrived during a volatile week for Treasury bonds. Bond prices fell even as equity markets touched record highs, a divergence that market analysts describe as bond investors signaling concern about the sustainability of federal borrowing, even as stock investors remain focused on corporate earnings and AI-driven growth.

U.S. Treasury Secretary Scott Bessent responded to the bond market pressure by expanding the Treasury’s debt buyback program, telling CNBC the size of buyback operations had been doubled to at least $4 billion per operation, with room to increase further. Buybacks are intended to support demand for existing Treasury securities and help stabilize yields during periods of market stress.

What Rising Debt Means for Ordinary Households

For everyday consumers, the national debt level itself is abstract, but its downstream effects are not. Elevated Treasury yields tend to push up borrowing costs across the economy, including mortgage rates, auto loans, and business credit. The same week the $40 trillion milestone was confirmed, average 30-year mortgage rates moved sharply, illustrating how bond market volatility connects directly to household borrowing costs.

Rising federal interest costs also narrow the government’s fiscal flexibility. As a larger share of the federal budget goes toward servicing debt rather than funding programs, policymakers face growing pressure to either cut spending, raise revenue, or both — choices that carry direct economic consequences for households and businesses alike.

What to Watch Next

The debt trajectory is expected to remain a central topic at the Federal Reserve’s Jackson Hole Economic Symposium, scheduled for August 27–29, 2026 — the first such gathering under new Fed Chair Kevin Warsh, who was confirmed by the Senate in a 54-45 vote in May 2026. While the symposium’s stated theme is financial innovation and payments policy, fiscal sustainability and its interaction with monetary policy are likely to feature in sideline discussions given the scale of the debt milestone.

Investors and households should watch upcoming Treasury auction results and any further changes to the buyback program as early indicators of how markets are digesting the government’s borrowing needs. A weak auction — one that requires higher yields to attract sufficient buyers — would be a signal that investor appetite for U.S. debt is softening further.

The $40 trillion figure is a threshold, not a crisis in itself. But combined with a bond market already showing signs of strain, it adds urgency to a fiscal conversation that has largely been deferred by successive Congresses and administrations.

Continue Reading

Trending