
Economics
AI meets old-school cost cutting and tariffs



Corporate America is getting rocked by historic rounds of white-collar layoffs, leading some to wonder: Has AI finally come for their jobs?
While the proliferation of generative and agentic artificial intelligence is playing a role, recent job cut announcements from companies like Amazon, UPS and Target are about a lot more than just the advance of new technology.
The firms, which each announced layoffs in recent weeks totaling more than 60,000 roles eliminated this year, said they’re trying to cut corporate bloat, streamline operations and adjust to new business models.
But in the absence of the Bureau of Labor Statistics’ monthly jobs report, which has gone dark amid the government shutdown, the layoff announcements have raised questions about the strength of the labor market and if it’s the start of an AI-driven, white-collar recession.
AI is likely playing a role in the layoffs because companies that are investing more in the technology need to cut costs elsewhere, but there is little to suggest the latest cuts are directly related to AI replacing a person’s job, labor experts and economists said.
“We spend a lot of time looking carefully at companies that are actually trying to implement AI, and there’s very little evidence that it cuts jobs anywhere near like the level that we’re talking about. In most cases, it doesn’t cut headcount at all,” said Peter Cappelli, a professor of management at the Wharton School and director of its Center for Human Resources. “Using AI and introducing it to save jobs turns out to be an enormously complicated and time consuming exercise … There’s still a perception that it’s simple and easy and cheap to do, and it’s really not.”
Still, the cuts, which come after a string of layoffs across the tech industry, have cast a dark cloud on a teetering economy that’s been wracked by persistent inflation, rising delinquencies, falling consumer sentiment and an average effective tariff rate that’s at its highest level in nearly a century, according to estimates from The Budget Lab at Yale University.
The growing pile of bad news has done little to shock the stock market, which is at near-record highs, but that’s largely because it’s been buoyed in part by by AI mega-caps.
Cappelli attributed the recent surge in layoff announcements to concerns about the state of the economy. He also noted a likely “bandwagon” effect in which companies see their competitors cutting so they too start making cuts.
“If it looks like everybody is cutting, then you say, ‘They must know something we don’t know,'” said Cappelli. He added investors often reward cutting: “They want to hear that you’re cutting because it looks like you’re doing something good. It looks like becoming more efficient.”
To be sure, AI and automation are potentially enabling some of the cuts, and the emerging technology is poised to help all companies reduce costs and boost efficiency in the coming years. But the reasons behind each layoff and the role AI is playing are nuanced, and vary company by company.
Starbucks’ decision to cut around 2,000 corporate jobs in two rounds this year is related to slowing sales at the company and a larger turnaround effort led by its new CEO, Brian Niccol. Layoffs at Meta’s AI unit, which impacted around 600 jobs, came as the company said it wants to operate more nimbly and reduce layers. Intel’s decision to lay off about 15% of its workforce came after it overinvested in chip manufacturing without adequate demand.
Together, they represent what John Challenger, the CEO of job placement firm Challenger, Gray & Christmas, described as a turning point in the economy and job market.
“We were in this no-hire, no-fire, type of zone. Economy was moving ahead. The labor markets were feeling pressure, but certainly, unemployment had stayed relatively strong,” he said. “These job cuts do suggest that the dam may be breaking as the economy slows.”
The earliest signals, he said, could be coming from retail, shipping and distribution.
The world’s largest startup
During the Covid-19 pandemic, Amazon went on a hiring spree in part to meet a surge in demand for e-commerce and cloud computing services, leading its corporate and frontline workforces to more than double to 1.3 million employees between 2019 and 2020.
By 2021, the company had swelled to 1.6 million employees globally, the same year Andy Jassy succeeded Jeff Bezos as CEO.
Since taking over, Jassy has been trying to undo some of that work.
Last week’s layoff announcement, impacting 14,000 corporate jobs, is expected to be the largest in the company’s history and to impact nearly every unit in the company. It marks Amazon’s second round of cuts in three years and amounts to more than 41,000 corporate job cuts since 2022, with more potentially on the way come 2026.
Though AI is part of the picture, there’s more at work behind the reductions.
Jassy said in the days following the announcement that the changes were neither AI- nor financially driven, but were instead to cut corporate fat so the company can operate as the world’s largest startup.
Amazon said it’s not replacing workers with AI, at least not yet, but it does need to cut employees so it can invest in the technology. As those costs come down, Amazon has earmarked hefty investments in cloud infrastructure to support AI workloads while simultaneously pushing out a flurry of AI services and tools across the company.
It’s contributed to a rise in capital expenditures, which are now expected to reach $125 billion this year, up from a prior forecast of $118 billion.
Jassy said previously that the company’s workforce would shrink in the future as a result of its embrace of generative AI but it still plans to keep hiring in “key strategic areas.” Over time, the company will need “fewer people doing some of the jobs that are being done today” but “more people doing other types of jobs,” Jassy said in June.
The cuts are also part of a larger goal of Jassy’s to make the company more nimble, reduce bureaucracy and remove layers so it can operate faster and smarter.
“It’s culture,” Jassy said during Amazon’s quarterly earnings call Thursday. “If you grow as fast as we did for several years, you know, the size of the businesses, the number of people, the number of locations, the types of businesses you’re in, you end up with a lot more people than what you had before, and you end up with a lot more layers.”
Smart money
In January, UPS announced a major change in its strategy.
The logistics firm said it was going to pare down its relationship with its largest customer, Amazon, in favor of higher-margin businesses that require fewer people to operate.
In fiscal 2024, Amazon shipments represented nearly 12% of revenue for UPS. The logistics giant said it was planning to reduce that volume by more than half by June because of the relatively low margins.
“This was not their ask. This was us. This was UPS taking control of our destiny,” CEO Carol Tomé told analysts in January.
In turn, UPS said it was pivoting to more profitable businesses, like health care, returns and business-to-business services and as a result, would require fewer resources.
“As we bring volume down, we will not only reduce the hours of miles associated with this volume, we will be able to take out fixed costs to match our capacity to our new expected volume levels,” finance chief Brian Dykes said in January. “We expect to close up to 10% of our building, cut back our vehicle and aircraft fleets and reduce labor.”
Last week the company said it had deepened previously planned job cuts for a total of 48,000 roles eliminated so far this year across operational employees and office workers.
In the first half of 2025, parcel volumes were down 5.4% at UPS compared to the year-ago period, according to data from ShipMatrix, and the company has been changing its corporate structure to adjust to lower volume.
The bulk of its layoffs this year, representing 34,000 operational jobs, were related to its decision to close 93 buildings – not replace people with robotics, the company said.
The 14,000 additional corporate roles it cut were partially related to AI, but the technology was not the primary driver, a spokesperson said.
Where AI and automation are expected to hit UPS most is in its future hiring plans.
As the company plans to bring automation to more of its facilities, it won’t need to hire as many people. Last week, UPS said 66% of its volume during the fourth quarter would come through automated facilities, up from 63% a year prior. That number is expected to move higher in the years ahead.
Still, that doesn’t necessarily mean those jobs are disappearing – some could be migrating from UPS to other companies, said Jason Miller, a professor of supply chain management at Michigan State University’s business school.
Miller said there’s a “reallocation” effect happening where one firm is losing business and shedding payroll — while another is gaining. The number of jobs may be the same, but the location, qualities and duties can differ, he said.
BLS data on the number of people employed in “courier” positions, which covers roles at places like UPS and Amazon, reflects that trend. As of August, courier positions were only down about 2% from their all-time high, and they’ve been on the rise over the last three years, the data show.
When tariffs bite
Target’s announcement last month that it would be cutting 1,800 jobs, representing about 8% of its corporate workforce, is a window into both consumer spending and the retailer’s own specific challenges.
It’s Target’s first major round of layoffs in a decade and comes after four years of roughly stagnant revenue. The retailer’s incoming CEO, Michael Fiddelke, said the cuts are about reducing complexity at a company that’s seen its workforce grow faster than sales.
Unlike some of its competitors, the bulk of Target’s revenue comes from the kinds of products that are nice to have, but not necessary, such as holiday mugs, trendy sweaters and home decor.
That means when consumer spending starts to slow down, Target feels it more acutely than its rival Walmart, which earns the majority of its revenue from groceries.
Slower consumer spending has been partially to blame for a decline in Target’s performance in recent years, but the introduction of tariffs, which are pushing prices higher, could make that impact even worse.
“Buyers’ willingness to pay is staying flat, inflation is high, income isn’t going very up so firms’ ability to sort of increase price to maintain their margin is being squeezed,” said Daniel Keum, an associate professor of management at Columbia Business School, who studies labor market dynamics. “If you can’t increase price, you have to reduce cost.
“How operationally do I manage cost?” Keum added. “I mean No. 1, like, let’s lay off white-collar people.”
Outside of macroeconomic conditions, Target’s business has also suffered from a number of self-inflicted challenges. The quality of its merchandise has taken a dive, fewer staff and frequent out-of-stocks have made its stores less enjoyable to shop in, customers and insiders told CNBC earlier this year. The retailer has also struggled to manage its inventory, which has impacted its profitability.
All of these issues combined have left Target with a workforce that has grown faster than sales and a complex corporate structure that has hampered decision-making and created needless red tape.
Between fiscal 2023 and fiscal 2024, Target’s global workforce grew 6% from 415,000 employees to 440,000, but in the same time period, sales declined 0.8%, according to company filings.
“The truth is, the complexity we’ve created over time has been holding us back,” Fiddelke told Target employees in a memo when announcing the job cuts. “Too many layers and overlapping work have slowed decisions, making it harder to bring ideas to life.”
He didn’t cite AI in his memo but did say the cuts will help the company execute faster so it can better “accelerate technology.”
— CNBC’s Melissa Repko and Steve Liesman contributed to this report.








Economics
U.S. National Debt Surpasses $40 Trillion for the First Time: What It Means for the Economy



Executive Summary & Core Macro Outlook
The United States enters the 2026–2030 macroeconomic window as the unquestioned heavyweight of nominal economic output, retaining its status as the primary engine of global financial liquidity, private enterprise innovation, and high-margin technological deployment. According to multi-year projections from the International Monetary Fund (IMF) World Economic Outlook and complementary datasets from the World Bank, the US nominal Gross Domestic Product (GDP) is projected to reach $32.38 trillion by 2026, accounting for approximately 25% of global nominal output and roughly 14.5% of world GDP measured at Purchasing Power Parity (PPP).
Unlike many of its advanced-economy peers across Western Europe and East Asia—which are grappling with acute demographic contraction and structural energy shocks—the United States demonstrates remarkable macroeconomic resilience. The IMF projects a real GDP Compound Annual Growth Rate (CAGR) of 2.1% to 2.3% through 2030. This expansion is sustained by three structural anchors: unmatched capital depth driving massive private-sector investment in Artificial Intelligence (AI) infrastructure, complete energy independence as a net exporter of hydrocarbons and liquefied natural gas (LNG), and high labor productivity gains that cushion the economy against rising debt-servicing costs.
Macroeconomic Data Matrix (2026–2030 Projections)
| Economic Metric | IMF / World Bank Baseline (2026–2030) | Global Benchmark & Context |
| Nominal GDP (2026 Projection) | ~$32.38 Trillion | Rank #1 Globally |
| GDP at Purchasing Power Parity (PPP) | ~$32.40 Trillion | Rank #2 Globally (Behind China’s ~$38.5T PPP) |
| Projected Real GDP CAGR (2026–2030) | 2.1% – 2.3% | Top decile among G7 advanced economies |
| Gross Public Debt (% of GDP) | ~122.5% – 128.0% | Structural fiscal deficit trajectory |
| Core Inflation Rate (PCE Target) | Stabilizing at 2.0% – 2.2% | Federal Reserve inflation target alignment |
| Current Account Balance (% of GDP) | -2.8% to -3.2% | Persistent capital import & reserve currency demand |
Deep Structural Growth Drivers
1. The AI Infrastructure Hyper-Cycle & TFP Expansion
The defining growth catalyst for the US economy over the 2026–2030 horizon is the unprecedented scale of private capital expenditure (Capex) poured into artificial intelligence infrastructure, enterprise software integration, and advanced computing hardware.
Major technology mega-caps and private equity funds are directing hundreds of billions of dollars annually into hyper-scale data centers, domestic semiconductor fabrication, high-voltage electrical grid upgrades, and AI-driven workflow platforms. According to World Bank economic research, technological adoption across American service and manufacturing sectors is driving a notable uptick in Total Factor Productivity (TFP). This productivity surge allows US companies to expand profit margins and output even in an environment characterized by higher structural real interest rates and tight skilled-labor markets.
2. Deep Capital Markets and Private Sector Liquidity
The structural backbone of US economic outperformance remains its financial system. US capital markets represent over 40% of global equity market capitalization and a vast majority of global venture capital and private credit assets.
This liquidity creates an efficient mechanism for capital allocation: high-potential emerging industries (such as quantum computing, synthetic biology, and advanced defense technology) receive early-stage funding at a scale that no other national market can match. When global monetary conditions tighten, global capital flees toward safety and yield, reinforcing US capital depth and lowering the relative cost of equity capital for American corporations.
3. Net Energy Independence & Industrial Cost Advantages
Unlike industrial hubs in Germany, Japan, or South Korea—which remain highly vulnerable to volatile sea-lane logistics and imported fuel price spikes—the United States operates as a major net exporter of petroleum, natural gas, and refined chemical products.
Access to abundant, cheap domestic natural gas provides US heavy industry, advanced manufacturing, and electricity-hungry data centers with a persistent structural cost advantage. Furthermore, federal policy frameworks (including the CHIPS and Science Act and clean energy tax provisions) continue to catalyze domestic private manufacturing investment, re-shoring high-value supply chains from East Asia back to the American Sunbelt and Midwest.
Macroeconomic Vulnerabilities & Downside Risks
1. Structural Sovereign Debt Trajectory
The most significant medium-term threat to US macroeconomic stability is the path of federal public debt. With gross national debt exceeding 120% of GDP and annual federal deficits running between 5% and 7% of GDP, the US fiscal baseline faces increasing structural pressure.
As older legacy low-yield Treasury bonds mature, they are refinanced at higher prevailing interest rates. According to IMF fiscal monitor assessments, federal net interest payments are absorbing an expanding share of total fiscal revenue, crowding out discretionary spending and narrowing the government’s capacity to deploy counter-cyclical fiscal stimulus during future downturns.
2. Commercial Real Estate (CRE) & Banking Sector Realignment
The structural transformation toward hybrid work models has permanently altered office space utilization across major US metropolitan areas. Regional and community banks, which hold a disproportionate share of commercial real estate debt, face ongoing balance-sheet pressure as legacy office loans mature and require refinancing at lower property valuations and higher interest rates. While systemic money-center banks remain well-capitalized, localized credit tightening from regional lenders presents a headwind for small-and-medium enterprise (SME) borrowing.
High-Outperformance Sector Matrix (2026–2030)
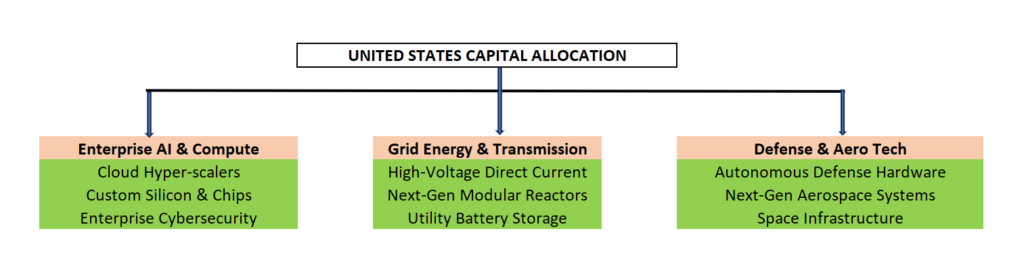
- Enterprise AI, Cloud Compute, & Cybersecurity: Companies building enterprise-grade software, AI agents, cloud architectures, and specialized hardware protection layers.
- Next-Generation Energy & Grid Modernization: Power generation utilities, high-voltage electrical equipment makers, small modular nuclear reactor (SMR) developers, and energy storage systems catering to exponential data center energy demands.
- Advanced Defense Technology & Aerospace: Autonomous systems, satellite networks, hypersonic defense, and advanced materials supplying both domestic security needs and global allied demand.
Strategic Summary for Global Investors & Executives
The United States through 2030 remains the ultimate high-volume, high-yield destination for institutional capital. While fiscal debt risks require long-term monitoring, the immediate 5-year outlook is defined by strong technology-driven productivity, resilient private consumption, and unmatched market liquidity. For global corporations and institutional allocators, exposure to the US economy remains an indispensable pillar of long-term growth strategy.
Top 65 Largest Economies in the World for 2027
Top 10 Largest Economies by 2030: IMF & World Bank GDP Projections for Global Powerhouses

Top 10 Largest Economies by 2030: IMF & World Bank GDP Projections for Global Powerhouses
The global macroeconomic landscape for the remainder of the decade is defined by structural divergence. According to updated multi-year projections from the International Monetary Fund (IMF) and the World Bank, the global economy is decoupling into two distinct tracks: mature powerhouses managing fiscal debt and artificial intelligence productivity gains, and rapid-scale emerging markets capitalizing on demographic dividends and trade corridor realignments.
Between 2026 and 2030, total global output is expected to expand significantly. However, nominal expansion remains intensely concentrated. Nearly half (~49.7%) of all net new global GDP generated through the end of the decade will originate from just three countries: China, the United States, and India.
This analytical report breaks down the macro baseline, structural growth drivers, and downside risks for the world’s top 10 economies through the 2030 horizon.
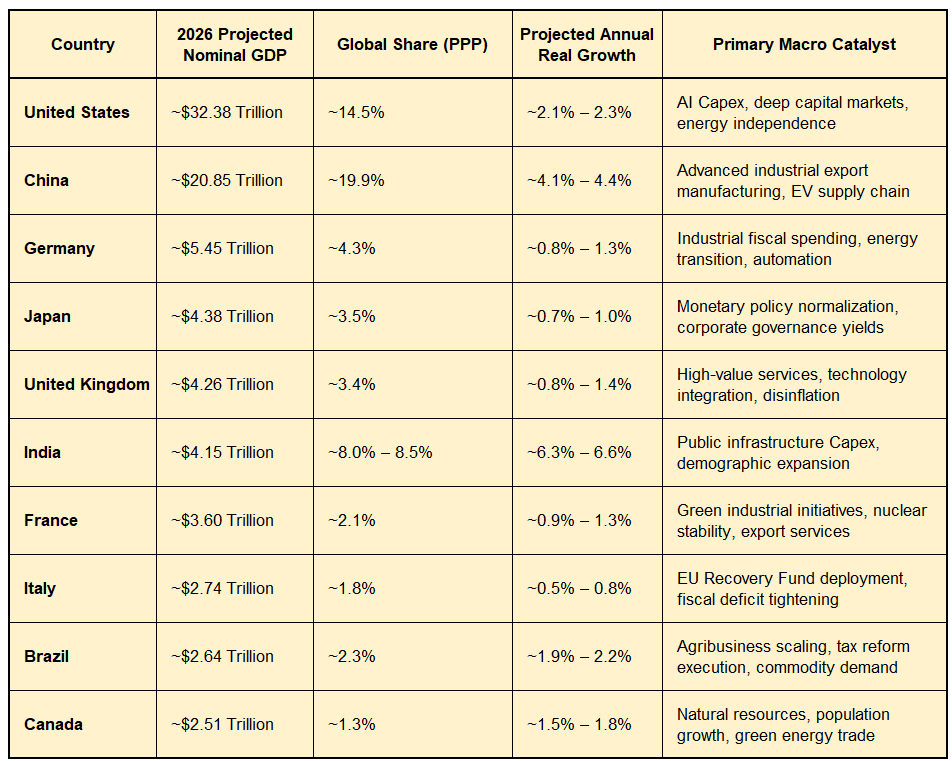
The Macro Baseline: Top 10 Economies (2026–2030)
Executive Summary: Key Structural Shifts Through 2030
1. Nominal Hegemony vs. Purchasing Power Powerhouses
A fundamental divergence persists when evaluating absolute output in current US dollars versus Purchasing Power Parity (PPP). While the United States maintains a strong lead in nominal market volume (~$32.38 trillion in 2026), China commands the largest share of world GDP in PPP terms (~19.9%). This gap means US-based corporate entities and enterprise capital markets maintain dollar-denominated revenue advantages, while China remains the world’s largest physical production and localized market engine.
2. The Great AI & Capital Capex Divide
The IMF highlights technology adoption—specifically Generative AI deployment and advanced semiconductor integration—as the single largest factor altering total factor productivity (TFP) among advanced economies through 2030. Nations leading in technology capital expenditures (US, Japan, parts of Western Europe) are insulating themselves against structural labor shortages caused by declining birth rates.
Macro Analysis of the Top 10 Heavyweights
The Two Growth Giants
1. United States: AI Innovation & Capital Market Supremacy
- 2026 Projected Nominal GDP: ~$32.38 Trillion
- Key Growth Drivers: Massive institutional investment in technology infrastructure, deep venture and capital markets, liquid debt markets, and complete net energy independence. Consumer demand remains resilient, buffered by tax adjustments and high wage growth.
- Core Vulnerabilities: Sovereign debt accumulation exceeding 120% of GDP, high interest servicing costs, and localized commercial real estate pressures.
2. China: Strategic Manufacturing & High-Tech Export Pivot
- 2026 Projected Nominal GDP: ~$20.85 Trillion
- Key Growth Drivers: A deliberate strategic transition from real estate-driven debt expansion toward “New Productive Forces”—specifically electric vehicles, advanced batteries, photovoltaics, and green industrial hardware.
- Core Vulnerabilities: Local government debt restructuring, household consumption constraints, demographic contraction, and Western trade tariffs impacting export margins.
India’s Acceleration vs. European Stagnation
3. India: The World’s Fastest-Growing Major Economy
- 2026 Projected Nominal GDP: ~$4.15 Trillion
- Key Growth Drivers: Compounding real annual growth above 6.3%. Accelerated government capital expenditure on railways, highways, and digital public infrastructure, combined with global supply chain re-shoring (e.g., electronics manufacturing).
- Trajectory to 2030: IMF long-term baseline scenarios project India overtaking both Japan and Germany in nominal GDP during the 2028–2030 window to become the world’s third-largest economy.
4. Germany, United Kingdom, and France: Industrial Restructuring
- Germany ($5.45T): Re-tooling its heavy industrial base post-Russian energy decoupling. Unlocking federal fiscal expansion for defense and green automation helps lift growth to 1.1%–1.3%.
- United Kingdom ($4.26T): Stabilizing fiscal policy, cooling inflation, and expanding tech services exports. However, structural labor tightness remains a key constraint.
- France ($3.60T): Benefiting from low-carbon nuclear energy security, but facing strict EU fiscal deficit mandates that necessitate budget tightening.
5. Japan & Italy: Navigating Demographic Aging
- Japan ($4.38T): Exiting decades of ultra-loose monetary policy. Corporate governance reforms, rising inward foreign direct investment (FDI) in semiconductor fabs, and mild inflation are restoring nominal growth.
- Italy ($2.74T): Reliant on targeted execution of the EU National Recovery and Resilience Plan (NRRP) to modernize infrastructure amid structural demographic headwinds.
Resource & Commodity Powerhouses
6. Brazil & Canada: Agri-Resource & Energy Anchors

- Brazil ($2.64T): Broadening its export footprint across soy, corn, iron ore, and crude oil. Implementation of a landmark value-added tax (VAT) reform improves corporate tax efficiency through 2030.
- Canada ($2.51T): Benefiting from natural resource exports, critical mineral reserves (lithium, nickel), and immigration-driven population growth that expands domestic labor supply.
Downside Risks to the 2026–2030 Baseline
- Geopolitical & Trade Fragmentation: Increasing tariff barriers and localized supply chain mandates threaten to slow global trade throughput.
- Sovereign Debt Strain: High global interest rates increase refinancing costs for both advanced economies (US, UK) and developing nations.
- Energy Market Disruption: Volatility in oil and natural gas prices risks re-igniting headline inflation, forcing central banks to tighten monetary policy.
Strategic Takeaways for Corporate Leaders & Investors
- Capital Allocation: Target the US and India for high market volume, capital depth, and consumer scaling.
- Supply Chain Re-shoring: Build manufacturing resilience by diversifying hardware production across Asia (China, India) and Europe (Germany).
- Productivity Levers: Institutionalize AI and automation early to offset demographic labor constraints in Western Europe and East Asia.

Treasury Bond Volatility Forces Bessent to Double Debt Buyback Size as Yields Swing

Nvidia Earnings Preview: What Wall Street Expects From the AI Bellwether’s Q2 Report

SEC’s Semiannual Reporting Proposal Faces Investor Pushback: What CFOs Need to Know

Armanino adds Strategic Accounting Outsourced Solutions

New 2023 K-1 instructions stir the CAMT pot for partnerships and corporations

Tax Strategy: Employee Retention Credit update
-

 Economics1 week ago
U.S. Retail Sales Fall for the First Time in Nine Months as Consumer Spending Slows
-

 Economics1 week ago
Nvidia’s Potential $3 Billion SB Energy Investment Could Reshape AI Infrastructure
-

 Economics3 days ago
Top 10 Largest Economies by 2030: IMF & World Bank GDP Projections for Global Powerhouses
-

 Stock News3 days ago
How to understand Intel $15B Stock Offering
-

 Technology7 days ago
U.S.-China AI Competition Intensifies as Washington Pushes Allies to Choose Sides
-

 Economics3 days ago
Economic Profile of the United States of America (2026–2030 Horizon)
-

 Economics2 days ago
U.S. National Debt Surpasses $40 Trillion for the First Time: What It Means for the Economy
-

 Leaders2 days ago
Jackson Hole 2026: What the First Symposium Under Fed Chair Kevin Warsh Means for Markets