Homemade barbecue pork chops. Katy Perry performs onstage during the Katy Perry The Lifetimes Tour 2025. A woman checks her receipt while exiting a store.
iStock| Theo Wargo | Hispanolistic | Getty Images
A few weeks ago, as Kiki Rough felt increasingly concerned about the state of the economy, she began thinking about previous periods of financial hardship.
Rough thought about the skills she learned about making groceries stretch during the tough times that accompanied past economic downturns. Facing similar feelings of uncertainty about the country’s financial future, she began making video guides to recipes from cookbooks published during previous recessions, depressions and wartimes.
The 28-year-old told followers that she is not a professional chef, but instead earned her stripes by learning to cook while on food stamps. From Rough’s yellow-and-black kitchen in the Chicago suburbs, she teaches viewers how to make cheap meals and at-home replacements for items like breakfast strudel or donuts. She often reminds people to replace ingredients with alternatives they already have in the pantry.
“I keep seeing this joke over and over in the comments: The old poors teaching the new poors,” Rough told CNBC. “We just need to share knowledge right now because everyone is scared, and learning is going to give people the security to navigate these situations.”
The self-employed consultant’s videos quickly found an audience on TikTok and Instagram. Between both platforms, she’s gained 350,000 followers and garnered about 21 million views on videos over the last month, by her count.
President Donald Trump’s announcement of broad and steep tariffs earlier in April has ratcheted up fears of the U.S. economy tipping into a recession in recent weeks. As Americans like Rough grow increasingly worried about the road ahead, they are harking back to the tips and tricks they employed to scrape by during dark financial chapters like the global financial crisis that exploded in 2008.
Google is predicting a spike in search volumes this month for terms related to the recession that came to define the late 2000s. Searches for the “Global Financial Crisis” are expected to hit levels not seen since 2010, while inquiries for the “Great Recession” are slated to be at their highest rate since the onset of the Covid pandemic.
Porkchops, house parties and jungle juice
On TikTok, a gaggle of Millennials and Gen Xers has stepped into the roles of older siblings, offeringflashbacks and advice to younger people on how to pinch pennies. Some Gen Zers have put out calls to elders for insights on what a recession may feel like at this stage of life, having been too young to feel the full effects of the financial crisis.
“This is, potentially, at least on a large scale, the first time that millennials have been able to be the ‘experts’ on something,” said Scott Sills, a 33-year-old marketer in Louisiana. “We’re the experts on getting the rug pulled out from under us.”
Those doling out the advice are taking a trip down memory lane the to tail-end of the aughts. Cheap getaways to Florida were the norm instead of lush trips abroad. They had folders for receipts in case big-ticket purchases went on sale later. Business casual outfits were commonplace at social events because they couldn’t afford multiple styles of clothing.
Porkchops were a staple dinner given their relative affordability, leading one creator to declare that they “taste like” the Great Recession. They drank “jungle juice” at house parties, a concoction of various cheap liquors and mixers, instead of cocktails at bars.
“There’s things that I didn’t realize were ‘recession indicators’ the first time around that I thought were just the trends,” said M.A. Lakewood, a writer and professional fundraiser in upstate New York. “Now, you can see it coming from 10 miles away.”
Customers shop for produce at an H-E-B grocery store on Feb. 12, 2025 in Austin, Texas.
Brandon Bell | Getty Images
To be sure, some of the discourse has centered around how inflationary pressures have made a handful of these hacks defunct. Some content creators pointed out that the federal minimum wage has sat at $7.25 per hour since 2009 despite the cost of living skyrocketing.
Kimberly Casamento recently began a TikTok series walking viewers through recipes from a cookbook that was focused on affordable meals published in 2009. The New Jersey-based digital media manager said she’s found costs for what were then considered low-budget meals ballooning between about 100% and 150%. In addition to sharing the price changes, the 33-year-old gives viewers some tips on how to keep costs down.
“Every aspect of life is so expensive that it’s hard for anybody to survive,” Casamento said. “If you can cut the cost of your meal by $5, then that’s a win.”
‘A very human thing’
This type of communal knowledge-sharing is common during times of economic belt tightening, according to Megan Way, an associate professor at Babson College who studies family and intergenerational economics. While conversations about how to slash costs or to make meals stretch typically took place among neighbors in the late 2000s, Way said it makes sense that they would now play out in the digital square with the rise of social media.
“It’s a very human thing to reach out to others when things are feeling uncertain and try to gain on their experience,” Way said. “It can really make a difference for feeling like you’re moving forward a little prepared. One of the worst things for an economy is absolute fear.”
Read more CNBC analysis on culture and the economy
Way said that Americans are quick to look back to the Great Recession for a guide because that downturn was so shocking and widely felt. However, she said there’s key differences between that economic situation and what the U.S. is facing today, such as the absence of bad debt that sparked the housing market’s crash.
Still, she said there’s broad uncertainty felt today on several fronts — be it tied to the economy, geopolitics or domestic policy priorities like slashing the federal workforce or limiting immigration. That can reignite the feeling of unpredictability about what the future will bring that was paramount during the Great Recession, Way said.
In 2025, it’s clear that economic confidence among the average American is rapidly souring. The University of Michigan’s index of consumer sentiment recorded one of its worst readings in more than seven decades this month.
With that negative economic outlook comes rising stress. When Lukas Battle made a satirical TikTok about feeling like divorces were increasingly common around the time of the Great Recession, the 27-year-old’s comments were abuzz with people talking about their parents splitting recently. (Though divorce has been seen as a cultural hallmark of the financial crisis, data shows the rate actually declined during this period.)
“There’s a second round of divorces happening as we speak,” Battle said.
Cultural parallels
That’s one of several parallels social media users have drawn between the late aughts and today. When videos surfaced of a group dancing to Doechii’s hit song “Anxiety,” several commenters on X reported feeling déjà vu to when flashmob performances were common.
Disney‘s reboot of the animated show “Phineas and Ferb,” which originally premiered in the late 2000s, similarly put the era top of mind.
Lady Gaga performing at Coachella 2017
Getty Images | Christopher Polk
“Recession pop,” a phrase mainly referring to the subgenre of trendy music that dropped during the Global Financial Crisis, has caught a second wave over the past year as Americans contended with inflation and high interest rates.
In 2008, artists such as Miley Cyrus, Lady Gaga and Katy Perry regularly appeared on the music charts. Both Cyrus and Gaga have released new songs this year. Perry kicked off a world tour this week.
“It’s almost a permission to feel good, whether that’s through song or something,” said Sills, the marketer in Louisiana. “It’s not necessarily ignoring the problems that are here, but just maybe finding some sort of joy or fun in the midst of all of it.”
Trade negotiations between the United States and Canada collapsed this week, with Canadian Prime Minister Mark Carney announcing that retaliatory tariffs on U.S. goods will take effect September 8, 2026. The breakdown follows the Trump administration’s imposition of 50% tariffs on certain Canadian goods, according to reporting from CNBC and the Washington Post.
What Happened
CNBC reported the collapse of talks as part of its ongoing business news coverage on August 22, 2026, noting the story as one of the week’s most significant developments for cross-border trade. The Washington Post’s business desk, in coverage also published August 22-23, quoted Carney characterizing President Trump’s 50% tariffs as “a miscalculation,” and confirmed the September 8 date for Canada’s retaliatory measures.
As of this writing, specific details on which categories of U.S. goods will be subject to Canadian retaliatory tariffs have not been fully reported. This article will be updated with additional specifics as they become available from primary government sources.
Why This Matters for Markets and Consumers
Trade disputes between the U.S. and its largest trading partners tend to have ripple effects across supply chains, consumer prices, and specific industry sectors with cross-border exposure. A Washington Post analysis accompanying the coverage noted that other countries unhappy with existing U.S. trade arrangements are likely watching the U.S.-Canada breakdown closely, suggesting the dispute could have implications beyond the immediate bilateral relationship.
Broader Context: A Volatile Week for Cross-Border and Fiscal News
The trade breakdown arrived during an already turbulent week for U.S. economic news. The same week saw the national debt cross $40 trillion for the first time, a sharp rise in Treasury bond market volatility, and the Treasury Department doubling the size of its debt buyback program. Whether the trade dispute has any direct connection to these fiscal and monetary developments has not been established in current reporting, but the concentration of major economic stories in the same week has drawn attention from market commentators tracking overall macroeconomic risk.
How This Fits the Broader Trade Policy Pattern
The U.S.-Canada breakdown is not occurring in isolation. Trade policy has been an active area of U.S. economic policymaking throughout 2026, with tariff actions and negotiations affecting multiple trading partners over the course of the year. Canada has historically been among the United States’ largest trading partners by total trade volume, meaning a prolonged dispute carries more direct economic exposure for both economies than a similar breakdown with a smaller trading partner would.
Industries with integrated North American supply chains — including automotive manufacturing, agriculture, and energy — have historically been among the most exposed to U.S.-Canada trade friction, given the degree to which components and raw materials cross the border multiple times during production. Businesses in these sectors should treat the September 8 deadline as a planning point regardless of whether it ultimately takes effect as announced.
What We Don’t Yet Know
Several material details remain unconfirmed or unreported as of this writing:
– The specific list of U.S. product categories subject to Canadian retaliatory tariffs
– Whether any further negotiations are scheduled between the September 8 deadline and the present
– Potential exemptions for critical supply chains, such as energy or auto parts, which have historically received special treatment in prior U.S.-Canada trade disputes
What to Watch Next
Businesses with cross-border exposure to Canadian suppliers or customers should monitor official statements from the U.S. Trade Representative’s office and Canada’s Department of Global Affairs for detailed tariff schedules ahead of the September 8 implementation date. Given the fluid nature of trade negotiations, a resumption of talks or a modified agreement before that date remains possible and would supersede current retaliatory tariff plans.
The U.S. gross national debt crossed $40 trillion for the first time this week, according to Treasury Department data reported by NPR on August 20, 2026. The milestone caps a period of rapid fiscal expansion: the debt has doubled since 2017, and the federal government now spends more than $1 trillion a year just servicing interest on what it owes.
Why the Debt Load Is Accelerating
The debt has not grown at a steady pace. Instead, a combination of pandemic-era spending, tax policy changes, and elevated interest rates has compounded the federal government’s borrowing costs. As older Treasury bonds issued at lower rates mature, they are being refinanced at today’s higher prevailing rates, which pushes up the government’s annual interest bill even without any new borrowing.
That interest bill is no longer a minor line item. At more than $1 trillion annually, debt servicing now competes directly with discretionary spending on defense, infrastructure, and social programs. Economists watching the trend note that this dynamic can become self-reinforcing: higher interest costs widen the deficit, which requires more borrowing, which in turn raises future interest costs.
Bond Market Reaction
The debt milestone arrived during a volatile week for Treasury bonds. Bond prices fell even as equity markets touched record highs, a divergence that market analysts describe as bond investors signaling concern about the sustainability of federal borrowing, even as stock investors remain focused on corporate earnings and AI-driven growth.
U.S. Treasury Secretary Scott Bessent responded to the bond market pressure by expanding the Treasury’s debt buyback program, telling CNBC the size of buyback operations had been doubled to at least $4 billion per operation, with room to increase further. Buybacks are intended to support demand for existing Treasury securities and help stabilize yields during periods of market stress.
What Rising Debt Means for Ordinary Households
For everyday consumers, the national debt level itself is abstract, but its downstream effects are not. Elevated Treasury yields tend to push up borrowing costs across the economy, including mortgage rates, auto loans, and business credit. The same week the $40 trillion milestone was confirmed, average 30-year mortgage rates moved sharply, illustrating how bond market volatility connects directly to household borrowing costs.
Rising federal interest costs also narrow the government’s fiscal flexibility. As a larger share of the federal budget goes toward servicing debt rather than funding programs, policymakers face growing pressure to either cut spending, raise revenue, or both — choices that carry direct economic consequences for households and businesses alike.
What to Watch Next
The debt trajectory is expected to remain a central topic at the Federal Reserve’s Jackson Hole Economic Symposium, scheduled for August 27–29, 2026 — the first such gathering under new Fed Chair Kevin Warsh, who was confirmed by the Senate in a 54-45 vote in May 2026. While the symposium’s stated theme is financial innovation and payments policy, fiscal sustainability and its interaction with monetary policy are likely to feature in sideline discussions given the scale of the debt milestone.
Investors and households should watch upcoming Treasury auction results and any further changes to the buyback program as early indicators of how markets are digesting the government’s borrowing needs. A weak auction — one that requires higher yields to attract sufficient buyers — would be a signal that investor appetite for U.S. debt is softening further.
The $40 trillion figure is a threshold, not a crisis in itself. But combined with a bond market already showing signs of strain, it adds urgency to a fiscal conversation that has largely been deferred by successive Congresses and administrations.
The United States enters the 2026–2030 macroeconomic window as the unquestioned heavyweight of nominal economic output, retaining its status as the primary engine of global financial liquidity, private enterprise innovation, and high-margin technological deployment. According to multi-year projections from the International Monetary Fund (IMF)World Economic Outlook and complementary datasets from the World Bank, the US nominal Gross Domestic Product (GDP) is projected to reach $32.38 trillion by 2026, accounting for approximately 25% of global nominal output and roughly 14.5% of world GDP measured at Purchasing Power Parity (PPP).
Unlike many of its advanced-economy peers across Western Europe and East Asia—which are grappling with acute demographic contraction and structural energy shocks—the United States demonstrates remarkable macroeconomic resilience. The IMF projects a real GDP Compound Annual Growth Rate (CAGR) of 2.1% to 2.3% through 2030. This expansion is sustained by three structural anchors: unmatched capital depth driving massive private-sector investment in Artificial Intelligence (AI) infrastructure, complete energy independence as a net exporter of hydrocarbons and liquefied natural gas (LNG), and high labor productivity gains that cushion the economy against rising debt-servicing costs.
Macroeconomic Data Matrix (2026–2030 Projections)
Economic Metric
IMF / World Bank Baseline (2026–2030)
Global Benchmark & Context
Nominal GDP (2026 Projection)
~$32.38 Trillion
Rank #1 Globally
GDP at Purchasing Power Parity (PPP)
~$32.40 Trillion
Rank #2 Globally (Behind China’s ~$38.5T PPP)
Projected Real GDP CAGR (2026–2030)
2.1% – 2.3%
Top decile among G7 advanced economies
Gross Public Debt (% of GDP)
~122.5% – 128.0%
Structural fiscal deficit trajectory
Core Inflation Rate (PCE Target)
Stabilizing at 2.0% – 2.2%
Federal Reserve inflation target alignment
Current Account Balance (% of GDP)
-2.8% to -3.2%
Persistent capital import & reserve currency demand
Deep Structural Growth Drivers
1. The AI Infrastructure Hyper-Cycle & TFP Expansion
The defining growth catalyst for the US economy over the 2026–2030 horizon is the unprecedented scale of private capital expenditure (Capex) poured into artificial intelligence infrastructure, enterprise software integration, and advanced computing hardware.
Major technology mega-caps and private equity funds are directing hundreds of billions of dollars annually into hyper-scale data centers, domestic semiconductor fabrication, high-voltage electrical grid upgrades, and AI-driven workflow platforms. According to World Bank economic research, technological adoption across American service and manufacturing sectors is driving a notable uptick in Total Factor Productivity (TFP). This productivity surge allows US companies to expand profit margins and output even in an environment characterized by higher structural real interest rates and tight skilled-labor markets.
2. Deep Capital Markets and Private Sector Liquidity
The structural backbone of US economic outperformance remains its financial system. US capital markets represent over 40% of global equity market capitalization and a vast majority of global venture capital and private credit assets.
This liquidity creates an efficient mechanism for capital allocation: high-potential emerging industries (such as quantum computing, synthetic biology, and advanced defense technology) receive early-stage funding at a scale that no other national market can match. When global monetary conditions tighten, global capital flees toward safety and yield, reinforcing US capital depth and lowering the relative cost of equity capital for American corporations.
3. Net Energy Independence & Industrial Cost Advantages
Unlike industrial hubs in Germany, Japan, or South Korea—which remain highly vulnerable to volatile sea-lane logistics and imported fuel price spikes—the United States operates as a major net exporter of petroleum, natural gas, and refined chemical products.
Access to abundant, cheap domestic natural gas provides US heavy industry, advanced manufacturing, and electricity-hungry data centers with a persistent structural cost advantage. Furthermore, federal policy frameworks (including the CHIPS and Science Act and clean energy tax provisions) continue to catalyze domestic private manufacturing investment, re-shoring high-value supply chains from East Asia back to the American Sunbelt and Midwest.
Macroeconomic Vulnerabilities & Downside Risks
1. Structural Sovereign Debt Trajectory
The most significant medium-term threat to US macroeconomic stability is the path of federal public debt. With gross national debt exceeding 120% of GDP and annual federal deficits running between 5% and 7% of GDP, the US fiscal baseline faces increasing structural pressure.
As older legacy low-yield Treasury bonds mature, they are refinanced at higher prevailing interest rates. According to IMF fiscal monitor assessments, federal net interest payments are absorbing an expanding share of total fiscal revenue, crowding out discretionary spending and narrowing the government’s capacity to deploy counter-cyclical fiscal stimulus during future downturns.
2. Commercial Real Estate (CRE) & Banking Sector Realignment
The structural transformation toward hybrid work models has permanently altered office space utilization across major US metropolitan areas. Regional and community banks, which hold a disproportionate share of commercial real estate debt, face ongoing balance-sheet pressure as legacy office loans mature and require refinancing at lower property valuations and higher interest rates. While systemic money-center banks remain well-capitalized, localized credit tightening from regional lenders presents a headwind for small-and-medium enterprise (SME) borrowing.
High-Outperformance Sector Matrix (2026–2030)
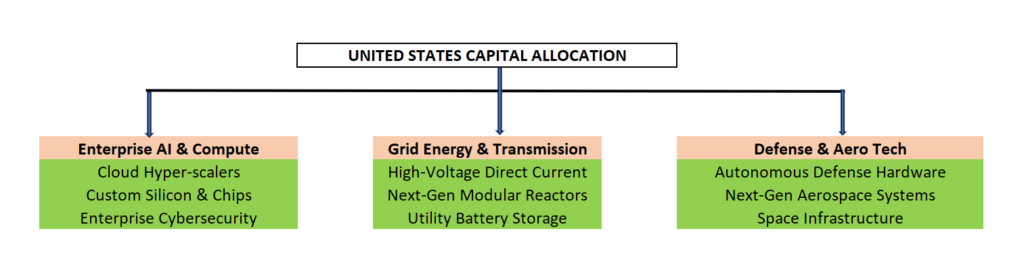
Enterprise AI, Cloud Compute, & Cybersecurity: Companies building enterprise-grade software, AI agents, cloud architectures, and specialized hardware protection layers.
Next-Generation Energy & Grid Modernization: Power generation utilities, high-voltage electrical equipment makers, small modular nuclear reactor (SMR) developers, and energy storage systems catering to exponential data center energy demands.
Advanced Defense Technology & Aerospace: Autonomous systems, satellite networks, hypersonic defense, and advanced materials supplying both domestic security needs and global allied demand.
Strategic Summary for Global Investors & Executives
The United States through 2030 remains the ultimate high-volume, high-yield destination for institutional capital. While fiscal debt risks require long-term monitoring, the immediate 5-year outlook is defined by strong technology-driven productivity, resilient private consumption, and unmatched market liquidity. For global corporations and institutional allocators, exposure to the US economy remains an indispensable pillar of long-term growth strategy.