Accounting
CPA Success Index ranks top collegiate accounting programs
The CPA Success Index was
Over the years, this index has become a trusted benchmark for identifying programs that consistently produce CPA-ready graduates. This updated ranking incorporates data from the 2023 edition of NASBA’s Candidate Performance on the Uniform CPA Examination book, which was released in late 2024. As with previous rankings, our analysis only reviews programs with greater than 20 candidates to ensure enough data points to adequately evaluate program performance.
Current top 10 CPA Success Index rankings
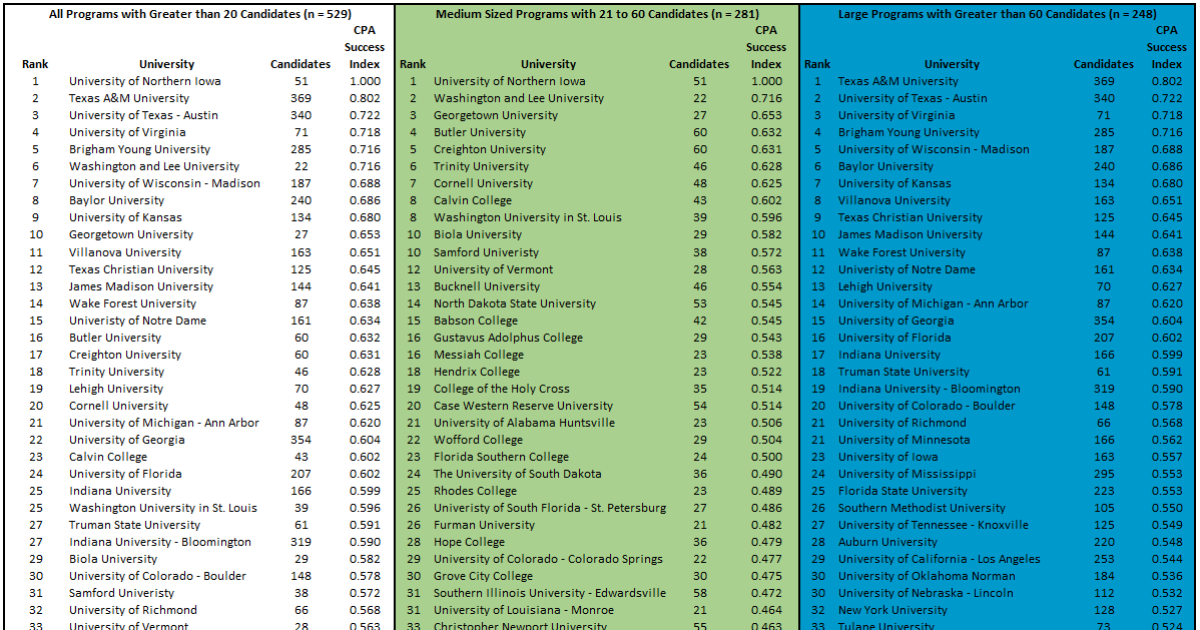
Based on NASBA’s most recently reported data from 2023, the top 10 accounting programs in the CPA Success Index are:
- University of Northern Iowa – Success Index: 1.000 (51 candidates)
- Texas A&M University – Success Index: 0.802 (369 candidates)
- University of Texas – Austin – Success Index: 0.722 (340 candidates)
- University of Virginia – Success Index: 0.718 (71 candidates)
- Brigham Young University – Success Index: 0.716 (285 candidates)
- Washington and Lee University – Success Index: 0.716 (22 candidates)
- University of Wisconsin – Madison – Success Index: 0.688 (187 candidates)
- Baylor University – Success Index: 0.686 (240 candidates)
- University of Kansas – Success Index: 0.680 (134 candidates)
- Georgetown University – Success Index: 0.653 (27 candidates)
Programs with consistent success over time
When comparing the latest rankings to previous reports, several programs stand out for their consistent performance. These four programs appear in the Top 10 in each of our CPA Success Rankings:
- Texas A&M University: A recurring top performer, Texas A&M benefits from its five-year integrated Professional Program in Accounting.
- University of Texas – Austin: This program has consistently ranked among the top schools, reflecting its robust accounting curriculum and exam preparation.
- University of Northern Iowa: Northern Iowa offers a unique and integrated faculty-led and for-credit CPA review program.
- University of Kansas: Kansas demonstrates sustained excellence through integrated coursework and focused CPA exam strategies.
The CPA Success Index continues to highlight institutions that not only prepare students academically but also provide the necessary support to ensure they succeed in passing the CPA exam. These institutions serve as examples of how academic structure, focused preparation and student support can bridge the CPA gap and help graduates successfully navigate the CPA exam. The average CPA Success Index for the 529 universities with greater than 20 candidates is .33 (the index is .30 for all schools in the NASBA report). For prospective accounting students and employers, these rankings offer valuable insights into programs that deliver on their promise of CPA readiness. As the accounting profession continues to face workforce shortages, the success of candidates remains essential for addressing the CPA pipeline challenges of the future.
The top 40
To be consistent with NASBA’s annual ranking of the top 40 universities on the single-part pass rate, we list the top 40 schools for CPA success in the table for all programs with greater than 20 candidates and split by program size, medium and large.


Accounting firms are reporting bigger profits and more clients, according to a new report.
The
Some 85% of firms now offer client advisory services, a big spike from 41% in 2023, indicating a strategic shift toward delivering forward-looking financial guidance that clients increasingly expect.
AI adoption is also reshaping the profession, with 80% of firms confident it will positively affect their practice. Currently, the most common use cases for AI include: delivering faster and more responsive client services (33%), enhancing accuracy by reducing bookkeeping and accounting errors (33%), and streamlining workflows through the automation of routine tasks (32%).
“The widespread adoption of AI has been a turning point for the accounting profession, giving accountants an opportunity to scale their impact and take on a more strategic advisory role,” said Ben Richmond, managing director, North America, at Xero, in a statement. “The real value lies not just in working more efficiently, but working smarter, freeing up time to elevate the human element of the profession and in turn, strengthen client relationships.”
Some of the main challenges faced by firms include economic uncertainty (38%), mastering AI (36%) and rising client expectations for strategic advice (35%).
While 85% of firms have embraced cloud platforms, a sizable number still lag behind, missing out on benefits such as easier data access from anywhere (40%) and enhanced security (36%).
Accounting
Private equity is investing in accounting: What does that mean for the future of the business?


Private equity firms have bought
The trend should not come as a surprise. It’s one we’ve seen play out in several industries from
How will this type of consolidation affect the accounting business, and what do firms and their clients need to be on the lookout for as the marketplace evolves?
Assessing the opportunity… and the risk
First and foremost, accounting firm owners need to be aware of just how desirable they are right now. While there has been some buzz in the industry about the growing presence of private equity firms, most of the activity to date has focused on larger, privately held firms. In fact, when we recently asked tax professionals about their exposure to private equity funding in our
Recent private equity deal volume suggests that the holdouts might change their minds when they have a real offer on the table. According to S&P Global, private equity and venture capital-backed deal value in the accounting, auditing and taxation services sector reached more than
Focus on tech and efficiencies of scale
The reason this trend is so important to everyone in the industry right now is that the private equity firms entering this space are not trying to become accountants. They are looking for profitable exits. And they will do that by seizing on a critical inflection point in the industry that’s making it possible to scale accounting firms more rapidly than ever before by leveraging technology to deliver a much wider range of services at a much lower cost. So, whether your firm is interested in partnering with private equity or dead set on going it alone, the hyperscaling that’s happening throughout the industry will affect you one way or another.
Private equity thrives in fragmented businesses where the ability to roll up companies with complementary skill sets and specialized services creates an outsized growth opportunity. Andrew Dodson, managing partner at Parthenon Capital, recently commented after his firm took a stake in the tax and advisory firm
Over time, this could reshape the industry’s market dynamics by creating the accounting firm equivalent of the Traveling Wilburys — supergroups capable of delivering a wide range of specialized services that smaller, more narrowly focused firms could never previously deliver. It could also put downward pressure on pricing as these larger, platform-style firms start finding economies of scale to deliver services more cost-effectively.
The technology factor
The great equalizer in all of this is technology. Consistently, when I speak to tax professionals actively working in the market today, their top priorities are increased efficiency, growth and talent. Firms recognize they need to streamline workflows and processes through more effective use of technology, and they are investing heavily in AI, automation and data analytics capabilities to do that. Private equity firms, of course, are also investing in tech as they assemble their tax and accounting dream teams, in many cases raising the bar for the industry.
The question is: Can independent firms leverage technology fast enough to keep up with their deep-pocketed competition?
Many firms believe they can, with some even going so far as to


The House-passed version of President Donald Trump’s massive tax and spending bill would deliver a financial blow to the poorest Americans but be a boon for higher-income households, according to a new
The bottom 10% of households would lose an average of about $1,600 in resources per year, amounting to a 3.9% cut in their income, according to the analysis released Thursday. Those decreases are largely attributable to cuts in the Medicaid health insurance program and food aid through the Supplemental Nutrition Assistance Program.
Households in the highest 10% of incomes would see an average $12,000 boost in resources, amounting to a 2.3% increase in their incomes. Those increases are mainly attributable to reductions in taxes owed, according to the report from the nonpartisan CBO.
Households in the middle of the income distribution would see an increase in resources of $500 to $1,000, or between 0.5% and 0.8% of their income.
The projections are based on the version of the tax legislation that House Republicans passed last month, which includes much of Trump’s economic agenda. The bill would extend tax cuts passed under Trump in 2017 otherwise due to expire at the end of the year and create several new tax breaks. It also imposes new changes to the Medicaid and SNAP programs in an effort to cut spending.
Overall, the legislation would add $2.4 trillion to US deficits over the next 10 years, not accounting for dynamic effects, the CBO previously forecast.
The Senate is considering changes to the legislation including efforts by some Republican senators to scale back cuts to Medicaid.
The projected loss of safety-net resources for low-income families come against the backdrop of higher tariffs, which economists have warned would also disproportionately impact lower-income families. While recent inflation data has shown limited impact from the import duties so far, low-income families tend to spend a larger portion of their income on necessities, such as food, so price increases hit them harder.
The House-passed bill requires that able-bodied individuals without dependents document at least 80 hours of “community engagement” a month, including working a job or participating in an educational program to qualify for Medicaid. It also includes increased costs for health care for enrollees, among other provisions.
More older adults also would have to prove they are working to continue to receive SNAP benefits, also known as food stamps. The legislation helps pay for tax cuts by raising the age for which able bodied adults must work to receive benefits to 64, up from 54. Under the current law, some parents with dependent children under age 18 are exempt from work requirements, but the bill lowers the age for the exemption for dependent children to 7 years old.
The legislation also shifts a portion of the cost for federal food aid onto state governments.
CBO previously

Amazon is selling an $800 portable power station for $550, and shoppers 'love the mobile design and durability'

Amazon is selling a 'high-quality' $525 Citizen Eco-Drive watch for $260, and buyers love its 'useful functions'

Accounting firms seeing increased profits

New 2023 K-1 instructions stir the CAMT pot for partnerships and corporations

The Essential Practice of Bank and Credit Card Statement Reconciliation

Are American progressives making themselves sad?
-

 Economics1 week ago
Jobs report May 2025:
-

 Economics1 week ago
Donald Trump has many ways to hurt Elon Musk
-

 Economics6 days ago
Sending the National Guard to LA is not about stopping rioting
-

 Finance1 week ago
Stocks making the biggest moves midday: WOOF, TSLA, CRCL, LULU
-
Economics1 week ago
Donald Trump has many ways to hurt Elon Musk
-

 Blog Post6 days ago
Mastering Bookkeeping Tasks During Peak Business Seasons
-

 Personal Finance6 days ago
What Pell Grant changes in Trump budget, House tax bill mean for students
-

 Finance6 days ago
China’s EV race to the bottom leaves a few possible winners