
Economics
How Trump’s trade policy is putting pressure on U.S. farmers


Soy farmer Caleb Ragland on his farm in Magnolia, Kentucky
Courtesy: American Soybean Association
Caleb Ragland, a soybean farmer in Magnolia, Ky., voted for President Donald Trump in 2016, 2020 and 2024. Now, however, he has to navigate a tariff minefield at a time when the sector is already facing major headwinds.
Ragland works with his wife and three sons and has deep roots in the community. His family has been farming on the land for more than two centuries. But over the past few years, he has seen a double-digit percentage decline in crop prices while production costs rise. Soybean futures have gone down more than 40% over the past three years along with corn futures.

Soybean futures vs. corn futures since 2022
As pressures mount in the industry as a result of tariffs imposed by the second Trump administration — as well as retaliatory levies from other countries — he’s worried about the longevity of his business.
“My sons potentially could be the 10th generation if they’re able to farm,” Ragland, who is also the president of the American Soybean Association, told CNBC. “And when you have policies that are completely out of our control – that they manipulate our prices 20%, 30%, and on the flip side, our costs go up – we won’t be able to stay in business.”
This isn’t the first time farmers have had to deal with new tariffs. Back in Trump’s first term, the trade war with China in 2018 — a time when Ragland said the agricultural economy was “in a much better place than it is right now” — cost the U.S. agriculture industry more than $27 billion, and soybeans made up virtually 71% of annualized losses.
That trade war has caused lasting damage. To this day, the U.S. has yet to fully recover its loss in market share of soybean exports to China, the world’s number one buyer of the commodity, according to the ASA.
“Tariffs break trust,” Ragland said. “It’s a lot harder to find new customers than it is to retain ones that you already have.”
‘Insult to injury’
The White House last week imposed a 25% tariff on goods from Canada and Mexico alongside an additional 10% duty on Chinese imports.
While Trump soon reversed course by granting a one-month tariff delay for automakers Wednesday, then pausing tariffs a day later for some Canadian and Mexican goods until April 2, he said in an interview that aired Sunday on Fox News that tariffs “could go up” over time.
Tariffs on China were not included in these exemptions. China retaliated with levies of its own, which mainly target U.S. agricultural goods. Specifically, U.S. soybeans are now subject to an additional 10% tariff, while corn gets hit with an extra 15% charge.
“We’re already at the point that we’re unprofitable,” Ragland said. “Why on earth are we trying to add insult to injury for the ag sector by basically adding a tax?”
Ragland pointed out that he “appreciates the president’s ability to negotiate” and wants Trump to be successful for the sake of the country. However, he emphasized that those in the industry, especially soybean producers, don’t have any “elasticity in our ability to weather a trade war that takes away from our bottom line.”
“Folks are upset,” Ragland said about sentiment from other farmers, stressing that they all need relief through deals that reduce barriers to trade and a new five-year comprehensive farm bill – legislation that provides producers with key commodity support programs, among others. “You’re talking about people’s livelihoods,” he remarked.
Agriculture Secretary Brooke Rollins said last week that the Trump administration was reportedly weighing exemptions on some agricultural products from tariffs on Canada and Mexico. Trump’s adjusted measures Thursday included a reduced 10% tariff on potash, which is used for fertilizer.
More than 80% of American farmers’ potash needs are supplied by Canada, said Ken Seitz of Nutrien – a crop inputs and services provider based in Canada – during the BMO Global Metals, Mining & Critical Minerals Conference last month.
“As we look at the implications of tariffs for Nutrien, of course the biggest discussion is around potash, and that’s because in a market that’s kind of 10 million to 11 million tons in any given year, we ourselves supply about 40% of that market,” the company’s chief executive underscored during the conference. “We believe that the cost of tariffs will be passed on to the U.S. farmer.”
Weighing the outcomes
Even in the runup to the implementation of Trump’s tariffs, American farmers were sounding the alarm. Despite the latest Purdue University/CME Group Ag Economy Barometer reading showing that farmer sentiment overall improved in February, 44% of survey respondents disclosed that month that trade policy will be most important to their farms in the next five years.
“Usually when you ask a policy question, by far and away the most important policy is crop insurance,” Michael Langemeier, agricultural economist at Purdue University, said. “Crop insurance is right up there with apple pie and baseball. It’s a program that’s very well liked, because it provides a very effective safety net.”
“The fact that crop insurance was a distant second to trade policy speaks volumes,” he also said.
The February survey also showed that almost 50% of farmers said that they think a trade war leading to a significant decrease in U.S. agricultural exports is “likely” or “very likely.” Langemeier estimated that between mid-February and early March, there was a 33% per acre drop in net return for soybeans and corn related to the tariffs. That’s on top of the fact that 2025 was “not ending up to be an extremely profitable year before this,” he revealed.
The economist thinks there may be a bit of a downward adjustment in overall farmer sentiment in the near term. Nevertheless, a constructive consequence of the tariffs could be that they speed up the signing of a new farm bill, he said.
“Well, how in the world can you come up with the amounts for the trade payments if you don’t even know what the amounts for the farm bill are going to be,” Langemeier asserted. He expects that the new farm bill signing will take place at some point this year.
Looking to the upcoming spring season, Bank of America analyst Steve Byrne wrote in a Feb. 25 note that tariffs could lead to “more conservative purchases of crop inputs.” That would mean a risk of lower fertilizer purchases, which could affect not only Nutrien but others like Mosaic and CF Industries, the analyst noted.
Shares of those companies, as well as other farming-related stocks like AGCO and Deere, all sold off on March 3 and March 4 on the heels of Trump’s tariff announcement.
“I think we’ve seen the ag stock sell-off just because of general concerns that the farmer is going to not be as profitable this year,” Morningstar’s Seth Goldstein said in an interview with CNBC.
Over the past month, Mosaic has slid almost 8%, while CF Industries has fallen more than 8%. Nutrien has also lost more than 1%. AGCO and Deere have fared better in that time, gaining around 2% and about 1%, respectively.
When it comes to how this trade war will affect American farmers in the long term, Goldstein doesn’t see that meaningful of an impact. He anticipates that global trade flows will shift and cancel each other out over the next two to three years or so.
“While there may be a near-term impact this year of soybeans sitting in warehouses without really available buyers, I think eventually we would see other countries then start to buy more U.S. soybeans,” the equity strategist said. “Maybe China buys more soybeans from Brazil, but maybe a place like Europe then buys more soybeans from the U.S., and we get … not that much difference.”
As it stands, Brazil is forecast to be the world’s largest soybean producer ahead of the U.S. for the 2024/2025 marketing year, accounting for 40% of global production in the period, per the Department of Agriculture. For corn, on the other hand, the U.S. is forecast to be in the top spot, making up 31% of global production in the marketing year.
Others on Wall Street believe that tariffs will be more consequential on trade dynamics, however.
Kristen Owen, an analyst at Oppenheimer, predicts that the duties will likely solidify Brazil becoming the primary global producer for both corn and soy, whereas the U.S. will become a sort of incremental supplier to the world.
“Brazil specifically has more capacity to grow their acreage, more capacity to grow to increase their share of the global grain trade,” she said to CNBC. “Tariffs and some of the other decisions that the administration is making just accelerate some of that.”










Economics
U.S. National Debt Surpasses $40 Trillion for the First Time: What It Means for the Economy



Executive Summary & Core Macro Outlook
The United States enters the 2026–2030 macroeconomic window as the unquestioned heavyweight of nominal economic output, retaining its status as the primary engine of global financial liquidity, private enterprise innovation, and high-margin technological deployment. According to multi-year projections from the International Monetary Fund (IMF) World Economic Outlook and complementary datasets from the World Bank, the US nominal Gross Domestic Product (GDP) is projected to reach $32.38 trillion by 2026, accounting for approximately 25% of global nominal output and roughly 14.5% of world GDP measured at Purchasing Power Parity (PPP).
Unlike many of its advanced-economy peers across Western Europe and East Asia—which are grappling with acute demographic contraction and structural energy shocks—the United States demonstrates remarkable macroeconomic resilience. The IMF projects a real GDP Compound Annual Growth Rate (CAGR) of 2.1% to 2.3% through 2030. This expansion is sustained by three structural anchors: unmatched capital depth driving massive private-sector investment in Artificial Intelligence (AI) infrastructure, complete energy independence as a net exporter of hydrocarbons and liquefied natural gas (LNG), and high labor productivity gains that cushion the economy against rising debt-servicing costs.
Macroeconomic Data Matrix (2026–2030 Projections)
| Economic Metric | IMF / World Bank Baseline (2026–2030) | Global Benchmark & Context |
| Nominal GDP (2026 Projection) | ~$32.38 Trillion | Rank #1 Globally |
| GDP at Purchasing Power Parity (PPP) | ~$32.40 Trillion | Rank #2 Globally (Behind China’s ~$38.5T PPP) |
| Projected Real GDP CAGR (2026–2030) | 2.1% – 2.3% | Top decile among G7 advanced economies |
| Gross Public Debt (% of GDP) | ~122.5% – 128.0% | Structural fiscal deficit trajectory |
| Core Inflation Rate (PCE Target) | Stabilizing at 2.0% – 2.2% | Federal Reserve inflation target alignment |
| Current Account Balance (% of GDP) | -2.8% to -3.2% | Persistent capital import & reserve currency demand |
Deep Structural Growth Drivers
1. The AI Infrastructure Hyper-Cycle & TFP Expansion
The defining growth catalyst for the US economy over the 2026–2030 horizon is the unprecedented scale of private capital expenditure (Capex) poured into artificial intelligence infrastructure, enterprise software integration, and advanced computing hardware.
Major technology mega-caps and private equity funds are directing hundreds of billions of dollars annually into hyper-scale data centers, domestic semiconductor fabrication, high-voltage electrical grid upgrades, and AI-driven workflow platforms. According to World Bank economic research, technological adoption across American service and manufacturing sectors is driving a notable uptick in Total Factor Productivity (TFP). This productivity surge allows US companies to expand profit margins and output even in an environment characterized by higher structural real interest rates and tight skilled-labor markets.
2. Deep Capital Markets and Private Sector Liquidity
The structural backbone of US economic outperformance remains its financial system. US capital markets represent over 40% of global equity market capitalization and a vast majority of global venture capital and private credit assets.
This liquidity creates an efficient mechanism for capital allocation: high-potential emerging industries (such as quantum computing, synthetic biology, and advanced defense technology) receive early-stage funding at a scale that no other national market can match. When global monetary conditions tighten, global capital flees toward safety and yield, reinforcing US capital depth and lowering the relative cost of equity capital for American corporations.
3. Net Energy Independence & Industrial Cost Advantages
Unlike industrial hubs in Germany, Japan, or South Korea—which remain highly vulnerable to volatile sea-lane logistics and imported fuel price spikes—the United States operates as a major net exporter of petroleum, natural gas, and refined chemical products.
Access to abundant, cheap domestic natural gas provides US heavy industry, advanced manufacturing, and electricity-hungry data centers with a persistent structural cost advantage. Furthermore, federal policy frameworks (including the CHIPS and Science Act and clean energy tax provisions) continue to catalyze domestic private manufacturing investment, re-shoring high-value supply chains from East Asia back to the American Sunbelt and Midwest.
Macroeconomic Vulnerabilities & Downside Risks
1. Structural Sovereign Debt Trajectory
The most significant medium-term threat to US macroeconomic stability is the path of federal public debt. With gross national debt exceeding 120% of GDP and annual federal deficits running between 5% and 7% of GDP, the US fiscal baseline faces increasing structural pressure.
As older legacy low-yield Treasury bonds mature, they are refinanced at higher prevailing interest rates. According to IMF fiscal monitor assessments, federal net interest payments are absorbing an expanding share of total fiscal revenue, crowding out discretionary spending and narrowing the government’s capacity to deploy counter-cyclical fiscal stimulus during future downturns.
2. Commercial Real Estate (CRE) & Banking Sector Realignment
The structural transformation toward hybrid work models has permanently altered office space utilization across major US metropolitan areas. Regional and community banks, which hold a disproportionate share of commercial real estate debt, face ongoing balance-sheet pressure as legacy office loans mature and require refinancing at lower property valuations and higher interest rates. While systemic money-center banks remain well-capitalized, localized credit tightening from regional lenders presents a headwind for small-and-medium enterprise (SME) borrowing.
High-Outperformance Sector Matrix (2026–2030)
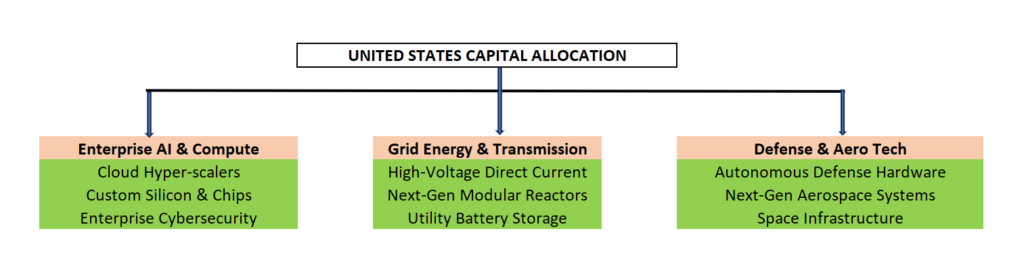
- Enterprise AI, Cloud Compute, & Cybersecurity: Companies building enterprise-grade software, AI agents, cloud architectures, and specialized hardware protection layers.
- Next-Generation Energy & Grid Modernization: Power generation utilities, high-voltage electrical equipment makers, small modular nuclear reactor (SMR) developers, and energy storage systems catering to exponential data center energy demands.
- Advanced Defense Technology & Aerospace: Autonomous systems, satellite networks, hypersonic defense, and advanced materials supplying both domestic security needs and global allied demand.
Strategic Summary for Global Investors & Executives
The United States through 2030 remains the ultimate high-volume, high-yield destination for institutional capital. While fiscal debt risks require long-term monitoring, the immediate 5-year outlook is defined by strong technology-driven productivity, resilient private consumption, and unmatched market liquidity. For global corporations and institutional allocators, exposure to the US economy remains an indispensable pillar of long-term growth strategy.
Top 65 Largest Economies in the World for 2027
Top 10 Largest Economies by 2030: IMF & World Bank GDP Projections for Global Powerhouses

U.S.- Canada Trade Talks Collapse; Carney Says Retaliatory Tariffs Begin September 8

Flock Cameras and the Future of Public Security

AI Infrastructure Boom Hits Physical Limits: Power, Financing, and Supply Chain Strain

Armanino adds Strategic Accounting Outsourced Solutions

New 2023 K-1 instructions stir the CAMT pot for partnerships and corporations

Tax Strategy: Employee Retention Credit update
-

 Stock News1 week ago
Nvidia Earnings Preview: What Wall Street Expects From the AI Bellwether’s Q2 Report
-

 Accounting1 week ago
SEC’s Semiannual Reporting Proposal Faces Investor Pushback: What CFOs Need to Know
-

 Stock News1 week ago
Nvidia Q2 FY2027 Earnings beats Wall Street Expectation with Record $96.2 Billion Revenue
-

 Finance1 week ago
Treasury Bond Volatility Forces Bessent to Double Debt Buyback Size as Yields Swing
-
 Technology4 days ago
AI Infrastructure Boom Hits Physical Limits: Power, Financing, and Supply Chain Strain
-
 Economics2 days ago
U.S.- Canada Trade Talks Collapse; Carney Says Retaliatory Tariffs Begin September 8
-
 Technology2 days ago
Flock Cameras and the Future of Public Security