
Economics
Private payrolls unexpectedly fell by 32,000












A Deep Analysis of Prices, Monetary Policy and Economic Risks
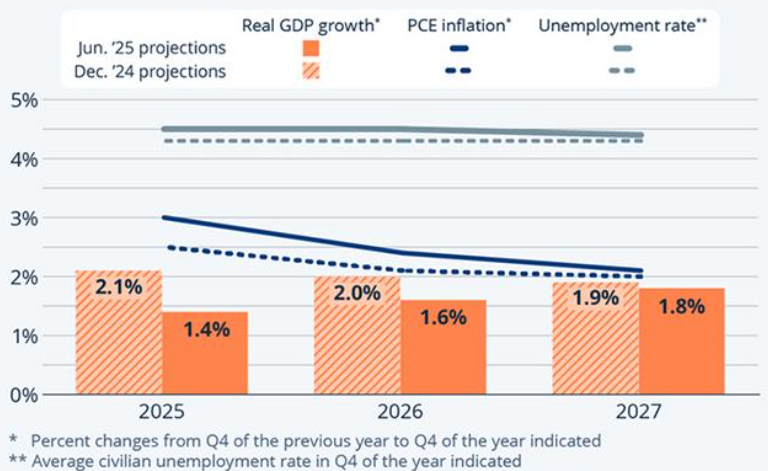
The U.S. inflation outlook for 2027 points toward substantial disinflation compared with the elevated price pressures experienced during 2026, but the path back to the Federal Reserve’s 2 percent objective is unlikely to be completely smooth. The most important official forecasts currently point toward inflation moving closer to target during 2027 as tariff-related price pressures fade, energy markets stabilize, monetary policy remains restrictive enough to moderate demand, and labor-market pressures become more balanced. The Federal Reserve’s June 2026 Summary of Economic Projections places median PCE inflation at 2.3 percent in 2027, compared with 3.6 percent in 2026, while its longer-run projection is 2 percent.


The International Monetary Fund (IMF) presents a broadly similar but somewhat more cautious picture. Its April 2026 World Economic Outlook projected U.S. consumer-price inflation at 2.1 percent in 2027, following 3.2 percent in 2026. The IMF’s April 2026 U.S. Article IV assessment also expects core PCE inflation to return to approximately 2 percent during the first half of 2027, although it identifies energy prices and other upside risks as important uncertainties.
The World Bank provides an important global context rather than a directly comparable U.S.-specific inflation target forecast. Its June 2026 Global Economic Prospects expects global conditions to improve during 2027–28 as energy supplies recover, inflation and uncertainty recede, and financial conditions ease. However, the institution also emphasizes that energy shocks, geopolitical tensions and commodity-market disruptions could continue generating inflationary pressure.
Federal Reserve Forecast: Inflation Moves Toward 2 Percent
The Federal Reserve’s projections provide perhaps the clearest benchmark for assessing the 2027 U.S. inflation forecast. In its June 2026 projections, the median forecast for PCE inflation is 2.3 percent in 2027, compared with 3.6 percent in 2026 and 2.0 percent in 2028. The central tendency for 2027 ranges from 2.2 percent to 2.5 percent, while the full participant range extends from 1.9 percent to 2.8 percent.
That forecast suggests that the Federal Reserve expects most of the inflation problem to be resolved during 2027 rather than immediately. Importantly, PCE inflation is the Fed’s preferred broad measure of consumer inflation, meaning its 2.3 percent projection should not be interpreted as a direct forecast for the Consumer Price Index. CPI and PCE can differ because they use different methodologies and expenditure weights.
The Fed’s forecast also implies an important monetary-policy transition. Its June projections place the median federal funds rate at 3.6 percent at the end of 2027, down from 3.8 percent at the end of 2026. This combination—falling inflation and gradually lower interest rates—would be consistent with a soft-landing environment in which monetary policy becomes less restrictive as price pressures moderate.
IMF Forecast: Core Inflation Could Reach 2 Percent in Early 2027
The IMF’s 2026 assessment provides an especially useful explanation for why inflation could decline during 2027. According to the IMF’s U.S. Article IV report, tariff-related inflationary effects are expected to diminish, allowing core PCE inflation to fall back to approximately 2 percent during the first half of 2027. The IMF nevertheless warns that headline inflation could remain somewhat higher because of movements in global oil prices.
This distinction between core and headline inflation is critical. Core inflation excludes food and energy because those categories can fluctuate sharply, while headline inflation includes them. If oil prices rise because of geopolitical disruptions, headline inflation could temporarily remain above the underlying trend even if domestic wage growth, rents and service prices are moderating.
The IMF’s April 2026 data also forecast U.S. average consumer-price inflation at 3.2 percent in 2026 and 2.1 percent in 2027. In other words, the IMF sees inflation moving very close to the Federal Reserve’s 2 percent objective by 2027.
World Bank Perspective: Energy Prices Remain a Major Risk
The World Bank’s analysis adds an important external dimension to the U.S. inflation outlook for 2027. Its June 2026 Global Economic Prospects argues that advanced-economy growth is being affected by higher energy prices, inflation, constrained energy supplies and tighter monetary conditions. At the same time, the World Bank expects energy supplies to recover over 2027–28, with inflation and uncertainty receding and financial conditions gradually easing.
For the United States, this means the inflation trajectory will depend not only on domestic demand but also on developments in global commodity markets. The U.S. economy is relatively large and diversified, but changes in crude oil, natural gas, transportation and other commodity prices can still affect household purchasing power and business costs.
The World Bank also highlights geopolitical risks. Its June outlook identifies prolonged disruptions to energy markets as a potential source of higher inflation and weaker global growth. Consequently, the most plausible 2027 scenario is not necessarily one of perfectly stable 2 percent inflation, but rather inflation that averages near target while remaining vulnerable to temporary external shocks.
Tariffs and the 2027 Inflation Path
One of the most important factors separating the 2027 outlook from the inflation environment of 2025–26 is the expected fading of tariff-related price effects. The Federal Reserve reported that inflation had moved higher as tariff increases pushed up prices for some consumer goods. The IMF similarly concluded that the inflationary impact of tariffs should wane as their pass-through to consumer prices is completed.
This creates a potentially favorable base effect for 2027. If tariffs raise the price level during one period but do not continue accelerating afterward, their contribution to the annual inflation rate can diminish. That does not mean consumers necessarily see prices return to earlier levels; rather, it means prices may increase more slowly.
This distinction is essential for households and businesses. Disinflation does not mean deflation. A decline from 3.5 percent inflation to 2 percent inflation means prices are still rising, simply at a slower pace. Consequently, the cumulative increase in the price level since the pandemic will remain an important economic issue even after the annual inflation rate approaches the Federal Reserve’s target.
Labor Markets and Services Inflation
Another critical variable for 2027 will be services inflation. Goods prices can respond relatively quickly to supply-chain normalization and changes in trade policy, whereas services prices are often more closely linked to wages, housing costs, insurance, healthcare and domestic demand.
The IMF expects U.S. employment growth to slow compared with the unusually strong pace of the years before the pandemic, while the unemployment rate is expected to remain near 4 percent in 2026–27. A labor market that remains healthy but less overheated would be favorable for disinflation because wage pressures could moderate without producing a severe employment contraction.
This is the foundation of the soft-landing scenario. If productivity continues improving while wage growth moderates gradually, businesses may be able to absorb higher labor costs without passing the entire increase to consumers. Conversely, renewed labor shortages or unexpectedly strong demand could make service-sector inflation more persistent.
The Main Risks to the 2027 Inflation Forecast
Although the baseline outlook is favorable, the official forecasts emphasize considerable uncertainty. The Federal Reserve’s historical forecast-error analysis indicates a wide potential range around inflation projections. Its estimated historical error range for total consumer prices in 2027 is approximately ±1.6 percentage points, illustrating why point forecasts should not be treated as precise predictions.
The major upside risks include another energy shock, renewed geopolitical conflict, stronger-than-expected consumer demand, persistent housing costs, renewed wage pressure and additional tariff increases. The IMF specifically identifies global energy prices as an upside inflation risk for the United States.
There are also downside risks. A sharper-than-expected slowdown in U.S. economic activity, weaker global demand, falling commodity prices or faster productivity growth could push inflation below the Federal Reserve’s target. The World Bank’s expectation that global inflation and uncertainty will recede during 2027–28 supports the possibility of a relatively benign external inflation environment.
2027 U.S. Inflation Forecast: Overall Assessment
Taken together, the Federal Reserve, IMF and World Bank outlooks point toward a significant improvement in U.S. inflation during 2027. The Fed’s 2.3 percent PCE inflation projection, the IMF’s 2.1 percent consumer-price forecast and its expectation that core PCE could reach approximately 2 percent in the first half of the year all indicate that inflation is likely to move substantially closer to the Federal Reserve’s long-run objective.
The most likely 2027 environment will be moderate inflation near, but not necessarily exactly at, 2 percent, combined with gradually less restrictive monetary policy. The biggest threat to this outlook is an external energy or geopolitical shock rather than a broad-based reacceleration of domestic inflation. The central question for investors, businesses and households will therefore shift from whether inflation is declining to whether it can remain sustainably close to target.
Ultimately, 2027 could represent an important transition point for the U.S. economy. If tariff effects fade, labor-market conditions remain balanced, productivity continues improving and global energy markets stabilize, the United States could enter a period of relatively stable prices and lower interest rates. If those assumptions fail, however, inflation could remain above target and force the Federal Reserve to maintain restrictive monetary policy for longer.
Key 2027 Inflation Indicators at a Glance
| Institution | 2026 Outlook | 2027 Outlook | Key Message |
|---|---|---|---|
| Federal Reserve | 3.6% PCE | 2.3% PCE | Inflation moves substantially closer to 2% |
| IMF | 3.2% consumer prices | 2.1% consumer prices | Near-target inflation by 2027 |
| IMF — Core PCE | Elevated | Around 2% by H1 2027 | Core inflation normalizes |
| World Bank | Inflation elevated by energy shock | Inflation expected to recede globally | Energy normalization supports disinflation |
Source note: The measures are not perfectly interchangeable. The Federal Reserve’s projection uses PCE inflation, while the IMF’s 2.1 percent figure is based on U.S. consumer prices. The World Bank’s contribution is primarily its global macroeconomic and commodity-market assessment.
For more reading, visit

Economics
U.S. National Debt Surpasses $40 Trillion for the First Time: What It Means for the Economy



U.S. Inflation Outlook for 2027

S&P 500 September Outlook: Tech Rally Holds Index at 7,600

India Unveils ‘Saptadhara’ Reform Agenda Targeting Technology, Youth Skilling, and Growth

Armanino adds Strategic Accounting Outsourced Solutions

New 2023 K-1 instructions stir the CAMT pot for partnerships and corporations

Tax Strategy: Employee Retention Credit update
-

 Technology1 week ago
AI Infrastructure Boom Hits Physical Limits: Power, Financing, and Supply Chain Strain
-

 Economics7 days ago
U.S.- Canada Trade Talks Collapse; Carney Says Retaliatory Tariffs Begin September 8
-
 Stock News3 days ago
S&P 500 September Outlook: Tech Rally Holds Index at 7,600
-
 Finance3 days ago
S&P 500 Outperforms Amid Strong Corporate Earnings as Treasury Yields Cap Equity Multiples
-

 Technology7 days ago
Flock Cameras and the Future of Public Security
-

 Insights3 days ago
Climate Resilience and Offshore Wind and Land Restoration Milestones
-

 Accounting3 days ago
Mandatory ESG Reporting Standards Demand Standardized Non-Financial Audit Trails
-
 Leaders3 days ago
India Unveils ‘Saptadhara’ Reform Agenda Targeting Technology, Youth Skilling, and Growth