
Finance
Study shows how long Social Security, $1.5M nest egg would last in 50 states


Ramsey Solutions financial expert George Kamel weighs in on Americans working past retirement age and provides advice for investors.
Retirement nest eggs and Social Security benefits are key sources of funds for many Americans as they live out their golden years in the state of their choosing.
A recently-released study from GOBankingRates looked at the financial runway that retirees would have in each state with Social Security benefits and $1.5 million socked away for retirement, finding West Virginia offered the most years before living costs would deplete their retirement savings.
The Mountain State ranked No. 1 with $1.5 million in retirement savings expected to sustain retirees there for a whopping 54 years while facing about $27,800 in living costs each year after Social Security benefits, according to the study.
The Social Security Administration (SSA) allows Americans to access their Social Security retirement benefits early starting at age 62, though payments “will be reduced a small percentage for each month before your full retirement age” if they do that, according to the SSA. One’s “full retirement age” depends on when a person was born.
SOCIAL SECURITY PAYMENTS TO INCREASE FOR PUBLIC PENSION RECIPIENTS
GOBankingRates said it used data from a slew of sources, including the Bureau of Labor Statistics, the SSA and Missouri Economic Research and Information Center, to determine its rankings of how states stack up in terms of the amount of time that Social Security and $1.5 million in retirement would last retirees residing in them.
Overall, the study indicated that those two sources of funds would provide different amounts of years of “financial security” for retirees in states across the country. States’ cost of living after Social Security ranged from $27,803 to $87,770 per year, it found.
401(K) BALANCES HIT SECOND HIGHEST ON RECORD: FIDELITY
GoBankingRates found the number of years that $1.5 million and Social Security would sustain retirees in each state was:
West Virginia: 54 years ($27,803 post-Social Security cost of living per year)

Charleston is the capital and largest city of the U.S. state of West Virginia. Slightly processed using HDR technique (iStock / iStock)
Kansas: 52 years ($28,945 post-Social Security cost of living per year)
Mississippi: 51 years ($29,426 post-Social Security cost of living per year)
Oklahoma: 51 years ($29,666 post-Social Security cost of living per year)
Alabama: 50 years ($30,207 post-Social Security cost of living per year)
Missouri: 50 years ($30,327 post-Social Security cost of living per year)
Arkansas: 49 years ($30,237 post-Social Security cost of living per year)
Tennessee: 49 years ($30,928 post-Social Security cost of living per year)
Iowa: 48 years ($31,168 post-Social Security cost of living per year)
Indiana: 47 years ($31,709 post-Social Security cost of living per year)

Aerial view of Indianapolis downtown with Statehouse in Indiana (iStock / iStock)
Georgia: 47 years ($31,829 post-Social Security cost of living per year)
North Dakota: 47 years ($32,190 post-Social Security cost of living per year)
Michigan: 46 years ($32,310 post-Social Security cost of living per year)
South Dakota: 46 years ($32,310 post-Social Security cost of living per year)
Texas: 46 years ($32,490 post-Social Security cost of living per year)
Nebraska: 46 years ($32,610 post-Social Security cost of living per year)
Kentucky: 46 years ($32,670 post-Social Security cost of living per year)
New Mexico: 46 years ($32,670 post-Social Security cost of living per year)
Louisiana: 45 years ($33,031 post-Social Security cost of living per year)
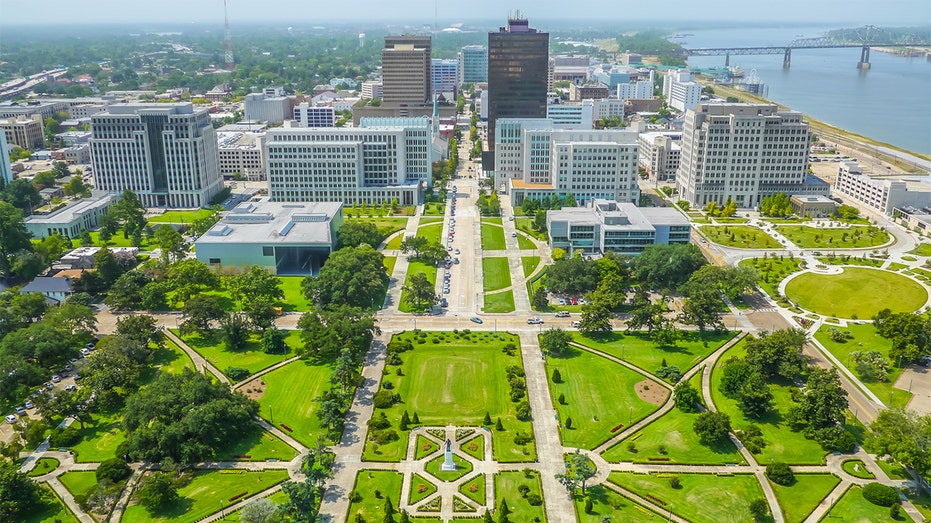
An aerial view of downtown Baton Rouge from the State Capitol building, looking towards the Mississippi bridge and river. (iStock / iStock)
Montana: 45 years ($33,331 post-Social Security cost of living per year)
Ohio: 44 years ($33,827 post-Social Security cost of living per year)
Pennsylvania: 44 years ($33,872 post-Social Security cost of living per year)
South Carolina: 44 years ($34,052 post-Social Security cost of living per year)
Minnesota: 44 years ($34,113 post-Social Security cost of living per year)
Wyoming: 44 years ($34,173 post-Social Security cost of living per year)
Illinois: 44 years ($34,233 post-Social Security cost of living per year)
North Carolina: 42 years ($35,495 post-Social Security cost of living per year)

Downtown Raleigh, North Carolina, USA Drone Skyline Aerial. (iStock / iStock)
Maryland: 41 years ($36,276 post-Social Security cost of living per year)
Wisconsin: 41 years ($36,516 post-Social Security cost of living per year)
Nevada: 41 years ($26,997 post-Social Security cost of living per year)
Delaware: 40 years ($37,057 post-Social Security cost of living per year)
Virginia: 40 years ($37,237 post-Social Security cost of living per year)
Idaho: 39 years ($38,379 post-Social Security cost of living per year)
Florida: 39 years ($38,379 post-Social Security cost of living per year)
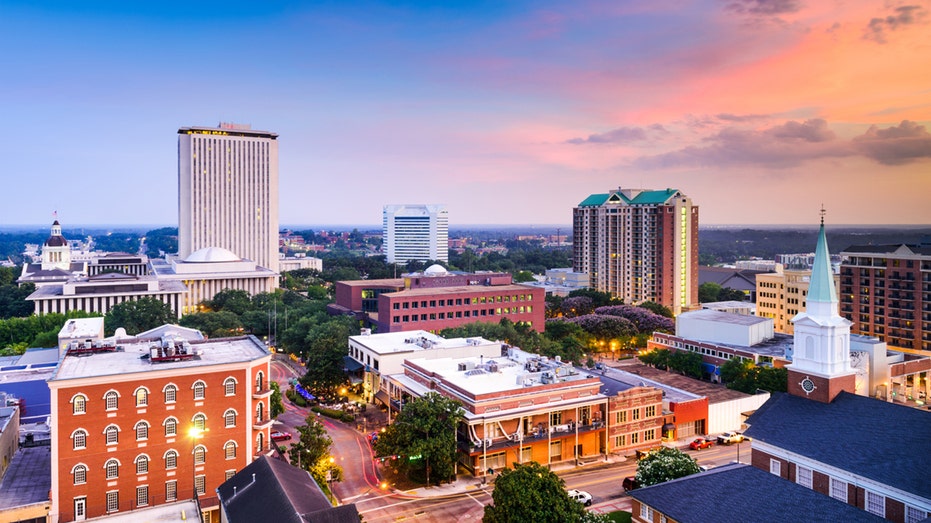
WalletHub published a report on Monday that found the best U.S. states to retire in 2022. Florida was at the top of the list. Tallahassee, Florida, is pictured. (iStock)
Colorado: 39 years ($38,559 post-Social Security cost of living per year)
Utah: 35 years ($42,645 post-Social Security cost of living per year)
Oregon: 35 years ($42,945 post-Social Security cost of living per year)
New Hampshire: 34 years ($43,847 post-Social Security cost of living per year)
Connecticut: 34 years ($43,967 post-Social Security cost of living per year)
Rhode Island: 34 years ($44,387 post-Social Security cost of living per year)
Arizona: 34 years ($44,628 post-Social Security cost of living per year
Maine: 33 years ($45,048 post-Social Security cost of living per year)
Washington: 33 years ($45,108 post-Social Security cost of living per year)
Vermont: 33 years ($45,409 post-Social Security cost of living per year)
New Jersey: 33 years ($45,829 post-Social Security cost of living per year)

The capital statehouse of New Jersey lights up as the sun sets the Delaware River in the background city of Trenton (iStock)
Alaska: 29 years ($50,997 post-Social Security cost of living per year)
New York: 29 years ($50,997 post-Social Security cost of living per year)
California: 24 years ($63,795 post-Social Security cost of living per year)
Massachusetts: 23 years ($65,117 post-Social Security cost of living per year)
Hawaii: 17 years ($87,770 post-Social Security cost of living per year)
THIS MIDWESTERN STATE IS CONSIDERED ONE OF THE BEST PLACES TO RETIRE, NEW STUDY SAYS: SEE THE LIST





Nvidia Q2 FY2027 Earnings beats Wall Street Expectation with Record $96.2 Billion Revenue

Treasury Bond Volatility Forces Bessent to Double Debt Buyback Size as Yields Swing

Nvidia Earnings Preview: What Wall Street Expects From the AI Bellwether’s Q2 Report

Armanino adds Strategic Accounting Outsourced Solutions

New 2023 K-1 instructions stir the CAMT pot for partnerships and corporations

Tax Strategy: Employee Retention Credit update
-

 Economics1 week ago
Nvidia’s Potential $3 Billion SB Energy Investment Could Reshape AI Infrastructure
-

 Economics4 days ago
Top 10 Largest Economies by 2030: IMF & World Bank GDP Projections for Global Powerhouses
-

 Stock News4 days ago
How to understand Intel $15B Stock Offering
-

 Technology1 week ago
U.S.-China AI Competition Intensifies as Washington Pushes Allies to Choose Sides
-
 Stock News1 day ago
Nvidia Earnings Preview: What Wall Street Expects From the AI Bellwether’s Q2 Report
-

 Economics4 days ago
Economic Profile of the United States of America (2026–2030 Horizon)
-

 Leaders3 days ago
Jackson Hole 2026: What the First Symposium Under Fed Chair Kevin Warsh Means for Markets
-

 Economics3 days ago
U.S. National Debt Surpasses $40 Trillion for the First Time: What It Means for the Economy