
Economics
The Domino Effect of Japan’s Rate Hikes On US Stocks and Treasuries Market Marks A New Era


The Era of Permanent Cheap Capital and Global Liquidity
For nearly three decades, the global financial system operated on a foundational premise that Japanese capital would remain permanently cheap, abundant, and virtually costless to borrow. Following the catastrophic collapse of Japan’s asset price bubble in the early 1990s, the Bank of Japan embarked on an unprecedented monetary experiment designed to combat entrenched deflation and economic stagnation. Through ultra-loose policies, including zero and negative interest rates alongside rigid yield curve control, Japanese policymakers created an environment where domestic yields were suppressed to near-zero levels. This persistent liquidity flood transformed Japan into the ultimate funding source for global financial markets. Investors around the world, ranging from international hedge funds and private equity firms to corporate treasuries and institutional asset managers, systematically borrowed trillions of low-yielding Japanese Yen. They converted these funds into foreign currencies to purchase higher-yielding risk assets across the globe, particularly within the United States. This cross-border strategy, known universally as the Yen carry trade, functioned as a continuous engine of global liquidity, inflating asset valuations, compressing volatility, and fueling continuous bull markets in US growth equities, corporate debt, and sovereign Treasuries.
The Monetary Pivot: Japan’s Historic Rate Hikes
However, when the Bank of Japan initiated a landmark shift toward monetary policy normalization, it effectively dismantled the structural mechanics of global financial leverage. Driven by rising domestic inflation, historic wage gains from corporate labor negotiations, and severe currency depreciation that threatened household purchasing power, Japanese central bankers brought an end to negative interest rates and yield curve control. They proceeded to raise benchmark policy rates to levels unseen in decades while signaling further monetary tightening. This policy turn occurred precisely as major Western central banks, including the Federal Reserve, were preparing to ease monetary conditions. The resulting convergence in interest rate differentials triggered a rapid and violent appreciation of the Japanese Yen against the United States dollar. As the funding currency surged in value, the foundational economics of the Yen carry trade collapsed almost overnight. Global market participants were confronted with skyrocketing debt servicing costs on their Yen liabilities, igniting a forced deleveraging cascade that rippled across international capital markets. The immediate aftermath was marked by severe selloffs in liquid US growth equities, massive spikes in global market volatility, and a profound structural realignment within the multi-trillion-dollar US Treasury market.

Us Dollar Bills
Historical Foundations: The Lost Decades and Unconventional Policy
To fully grasp the magnitude of this policy pivot, one must examine the long economic history that forced the Bank of Japan into uncharted monetary territory. Following the bursting of Japan’s real estate and equity market bubble, the domestic economy entered a prolonged period commonly referred to as the Lost Decades. Consumer demand plummeted, corporate balance sheets underwent severe debt-clearing processes, and price levels trended persistently downward. In response, Japanese monetary authorities pioneered unconventional policy tools long before Western central banks adopted them during the global financial crisis. By the late 1990s, the Bank of Japan had lowered its short-term interest rate target to absolute zero. When zero interest rates proved insufficient to reignite economic expansion and inflation, the central bank pushed benchmark borrowing costs into negative territory in early 2016. Under this negative interest rate framework, commercial banks were effectively charged for holding excess reserves with the central bank, a measure designed to compel financial institutions to extend credit into the real economy.
Yield Curve Control and the Search for Foreign Returns
To complement negative short-term interest rates, Japanese policymakers introduced an aggressive framework known as Yield Curve Control later in 2016. Under this regime, the Bank of Japan set explicit targets for ten-year Japanese Government Bond yields, maintaining a strict ceiling through continuous, open-ended bond purchasing operations. If market yields threatened to rise above the central bank’s target threshold, monetary authorities stood ready to buy unlimited quantities of domestic sovereign debt. This policy successfully capped domestic borrowing costs and suppressed yield volatility across the Japanese fixed-income landscape. However, the collateral consequence of artificially capping yields was a total distortion of capital pricing. With domestic savings yielding virtually zero return after accounting for inflation, Japanese institutional investors, pension funds, and life insurance companies were forced to look beyond their domestic borders in a desperate search for positive yield. Millions of private retail investors in Japan similarly migrated their savings into foreign currency deposits, high-dividend overseas equities, and international bond markets.
The Mechanics of the Yen Carry Trade Strategy
The mechanics of the Yen carry trade relied on a straightforward yet powerful economic premise. Market participants could borrow capital in Japanese Yen at essentially zero cost, execute foreign exchange transactions to convert those Yen into United States dollars, and deploy the proceeds into dollar-denominated assets offering significantly higher returns. As long as two conditions remained intact—a wide interest rate spread between the United States and Japan, and a stable or depreciating Japanese Yen—the carry trade operated as a self-reinforcing profit generator. When investors converted their borrowed Yen into dollars on the spot foreign exchange market, they generated continuous selling pressure on the Yen and buying pressure on the dollar. This persistent currency transaction caused the Yen to depreciate further, which in turn increased the unhedged profitability of the trade. The borrowing costs were minimal, the asset appreciation in American markets was substantial, and the foreign currency movement continually reduced the cost of paying back the original Yen loan when measured in dollars. Over several decades, this structural loop allowed global leverage to accumulate to unprecedented levels, with JPY-denominated liabilities serving as the foundational bedrock for global risk-taking.

Yen Note
Structural Vulnerabilities and Leverage Sensitivity
The structural fragility of the carry trade lies in its extreme exposure to currency fluctuations and interest rate shifts. When an investor executes an unhedged carry trade, their ultimate return depends not only on the yield differential between the two countries, but also on the percentage change in the exchange rate between the funding currency and the target currency. If the funding currency appreciates rapidly, the cost of servicing and repaying the debt increases in dollar terms, quickly eroding any yield spread previously earned. Because institutional fund managers and quantitative trading funds often deployed immense leverage to amplify the modest yield spreads inherent in fixed-income carry strategies, even minor movements in foreign exchange rates could threaten catastrophic capital losses. What appeared to be a low-risk, steady-income strategy during quiet market conditions concealed deep structural vulnerability, functioning as a financial mechanism that accumulated hidden risk until a macroeconomic catalyst forced an abrupt liquidation.
Domestic Inflation and the Wage-Price Catalyst
That macroeconomic catalyst materialized when Japan’s internal economic conditions underwent a dramatic transformation following global post-pandemic supply disruptions and commodity shocks. For the first time in thirty years, persistent inflation settled into the Japanese economy. Import prices surged, corporate profit margins expanded, and domestic businesses began passing elevated input costs on to end consumers. Crucially, inflation ceased to be purely imported and began taking root within the domestic labor market. During the annual spring labor negotiations, major Japanese corporations agreed to raise baseline employee wages by over five percent, marking the largest wage increase in more than three decades. Japanese policymakers had long maintained that sustainable, demand-driven inflation required a healthy wage-price spiral, where rising paychecks fuel consumer spending and support corporate pricing power. With wage growth accelerating and core consumer price inflation consistently exceeding the central bank’s two percent target, the Bank of Japan could no longer justify maintaining hyper-expansionary crisis policies.
Central Bank Convergence and Foreign Exchange Surges
In early 2024, the Bank of Japan commenced a deliberate shift away from its radical monetary experiments. The central bank formally abandoned its negative interest rate policy, lifting short-term interest rates back into positive territory for the first time in eight years, while simultaneously dismantling the Yield Curve Control framework. Rather than satisfying market expectations, this initial step was merely the beginning of a broader monetary tightening cycle. By mid-summer, monetary authorities raised the overnight call rate further to a range around a quarter of a percent and announced plans to systematically reduce their monthly purchases of Japanese Government Bonds. Subsequent policy statements confirmed that if economic activity and price trends aligned with projections, further rate hikes toward one percent and beyond would follow. This hawkish policy trajectory coincided with a period when the Federal Reserve was signaling an end to its own aggressive tightening cycle due to cooling American labor metrics, setting the stage for a dramatic narrowing of the interest rate differential between the two nations.
The Liquidation Spiral: Margin Calls and Forced Deleveraging
The convergence of central bank policies ignited a violent unwinding of the Yen carry trade across global capital markets. As international traders recognized that the interest rate gap was closing and that Japanese monetary authorities were actively intervening to support their domestic currency, the Japanese Yen appreciated at a rapid speed. In a matter of weeks, the exchange rate shifted dramatically, moving from historic lows near one hundred and sixty Yen per dollar toward much stronger levels. This sudden shift caught heavily leveraged market participants off guard. Global asset managers, hedge funds, and trend-following quantitative strategies suddenly faced massive unrealized losses on their currency positions. To cover their rapidly escalating Yen liabilities and meet stringent margin calls from prime brokers, investors were forced to sell off their most liquid overseas assets immediately.

New York Stock Exchange
Cross-Asset Volatility and Global Market Disruption
This forced deleveraging created a self-reinforcing liquidation loop that severely impacted global risk assets. To repay Yen-denominated loans, fund managers had to sell American stocks and Treasuries, convert the dollar sales back into Japanese Yen on the spot market, and transfer those Yen to domestic Japanese lenders. This surge in market demand for the Yen accelerated currency appreciation, which in turn triggered additional margin calls for remaining carry trade participants. The market impact was instantaneous and widespread. Stock exchanges in Tokyo suffered historic single-day crashes, while global volatility measures spiked to levels comparable only to the most severe financial crises in modern history. The cross-asset selloff demonstrated that what had originated as a domestic policy tweak in Tokyo had transformed into a systemic deleveraging event for the entire Western financial architecture.
US Equity Vulnerability: Technology Equities under Pressure
The impact of this deleveraging cycle on the United States stock market was immediate, concentrated, and structurally profound. For years, cheap JPY funding had been funneled into high-momentum American technology stocks. Because mega-cap technology corporations offered exceptional earnings growth and high liquidity, they served as the primary destination for leveraged global capital. When the margin call cascade hit, these high-performing technology equities became the first assets sold off to satisfy collateral requirements. The sheer liquidity of mega-cap tech stocks, which had made them so attractive during the market uptrend, turned into a vulnerability during the liquidation process. As systematic strategies, risk-parity funds, and commodity trading advisors rushed to reduce overall portfolio exposure, high-multiple growth stocks endured rapid price contractions, driving sharp declines across broad American equity benchmarks.
Permanent Capital Costs and Equity Multiple Squeezes
Beyond the immediate price drops, the ending of cheap Yen loans imposed a lasting structural constraint on American stock valuations. The availability of low-cost cross-border leverage had long served as a key liquidity buffer, allowing fund managers to apply higher multiples to future corporate earnings. With Japanese interest rates rising and currency volatility remaining elevated, the net cost of global capital permanently increased. Investors could no longer rely on endless streams of cheap credit to inflate asset prices, forcing a broader market rotation toward fundamental balance sheet strength. Equities with robust free cash flows, low debt obligations, and defensive market positions demonstrated relative resilience, while speculative, non-profitable growth companies faced severe valuation compression. The market was forced to re-price equity risk in an environment where global liquidity was no longer guaranteed by the Bank of Japan.

Bank of Japan Gov. Kazuo Ueda, left, and Japanese Prime Minister Sanae Takaichi
US Sovereign Debt Impact: The Largest Foreign Creditor Shifts
While equity markets experienced high-frequency volatility during the unwinding, the United States Government Bond market faced a far more enduring, structural realignment. Japan occupies a unique position within the American sovereign debt landscape, holding the title of the largest single foreign creditor to the United States government. Japanese institutional investors, life insurance companies, commercial banks, and public pension funds collectively hold well over one trillion dollars in United States Treasury securities. For decades, these institutional entities provided a reliable pool of capital for American sovereign debt auctions, absorbing substantial portions of newly issued bonds and helping keep long-term borrowing costs low for the United States government.
Currency Hedging Breakdown and Negative Net Yields
However, the economics governing Japanese institutional investment in United States Treasuries underwent a fundamental breakdown due to shifting interest rate differentials and currency hedging dynamics. When a Japanese life insurance company or pension fund purchases American sovereign bonds, it typically hedges the inherent foreign exchange risk using currency swaps or forward contracts to prevent currency fluctuations from wiping out fixed-income returns. The cost of this foreign exchange hedge is determined primarily by the short-term interest rate spread between the United States dollar and the Japanese Yen. When the Federal Reserve raised rates aggressively while the Bank of Japan maintained rates near zero, the short-term interest rate gap widened dramatically, driving foreign exchange hedging costs to extraordinary highs.
The Retreat of Japanese Institutional Capital
As currency hedging costs escalated, they completely consumed the nominal yield advantage offered by United States Treasuries over Japanese Government Bonds. Even when ten-year American Treasury yields hovered at attractive levels above four percent, the net yield earned by a Japanese institutional investor—after paying for the required currency hedge—dropped into negative territory. Japanese institutional funds were effectively paying a premium to hold hedged American debt compared to holding domestic sovereign bonds. Consequently, these major global buyers halted their expansion into American fixed income, reducing their participation in Treasury auctions and allowing existing holdings to mature without re-investing the capital. The absence of this major foreign buyer required the United States Treasury to depend more heavily on domestic price-sensitive buyers, introducing upward pressure and structural volatility into long-term sovereign bond yields.
Capital Repatriation and the Home-Bias Movement
The broader consequence of Japan’s monetary normalization is a long-term shift in cross-border capital flows, defined by a structural home-bias repatriation of Japanese wealth. For decades, Japanese capital fled domestic shores because domestic yields were inadequate to meet long-term pension liabilities and insurance payout obligations. As the Bank of Japan permits domestic yields on ten-year Japanese Government Bonds to rise toward multi-year highs, the domestic market is once again offering viable nominal returns without foreign exchange risk. Japanese institutional investors are discovering that they can achieve acceptable risk-adjusted yields at home, eliminating the complex legal, operational, and currency risks associated with maintaining massive overseas portfolios. This capital repatriation process creates a steady, structural drain of liquidity from Western capital markets back to Tokyo.
Elevated Term Premia and the High-Cost-of-Capital Era
This global capital realignment carries deep implications for the future path of global interest rates and national debt management. For the United States, the retreat of price-insensitive foreign central bank buyers comes at a time when federal budget deficits remain elevated, requiring massive continuous issuances of new sovereign debt. Without the stabilizing presence of Japanese institutional demand, the term premium—the extra yield demanded by investors to hold long-term debt—must structurally expand. This dynamic ensures that long-term interest rates in the United States may remain elevated even if the Federal Reserve chooses to reduce short-term benchmark rates. The global cost of capital has effectively established a higher floor, fundamentally altering the macroeconomic conditions for corporate borrowing, mortgage pricing, and sovereign debt servicing worldwide.

Risk Management Adaptation for Global Portfolios
In this transformed financial ecosystem, institutional and retail investors must completely re-evaluate their approaches to portfolio construction and risk management. The assumption that global liquidity will always remain abundant, or that cross-border currency carry trades offer a safe source of passive yield, has been thoroughly disproven. Modern risk management frameworks must account for the reality that central bank monetary policies are increasingly interconnected, and that policy shifts in Tokyo can trigger sudden deleveraging events in New York, London, and Frankfurt. Managing currency exposure, monitoring cross-border capital flows, and accounting for shifting term premia are no longer secondary considerations; they are essential requirements for navigating global markets.
Conclusion: The New Paradigm in Global Macroeconomics
Ultimately, the Bank of Japan’s exit from its extreme monetary policy represents a historic turning point for the global economy. By dismantling the mechanics that enabled decades of low-cost Yen borrowing, Japanese monetary authorities have forced financial markets to confront the true cost of global capital. While the initial phases of this transition produced sharp volatility spikes across equity markets and disruptions in fixed income, the long-term result is a return to fundamental capital pricing. As global investors adapt to this new paradigm, success will depend on identifying businesses with strong intrinsic cash flows, managing leverage prudently, and recognizing that the era of unlimited, zero-cost cross-border liquidity has come to an end.
A Deep Analysis of Prices, Monetary Policy and Economic Risks
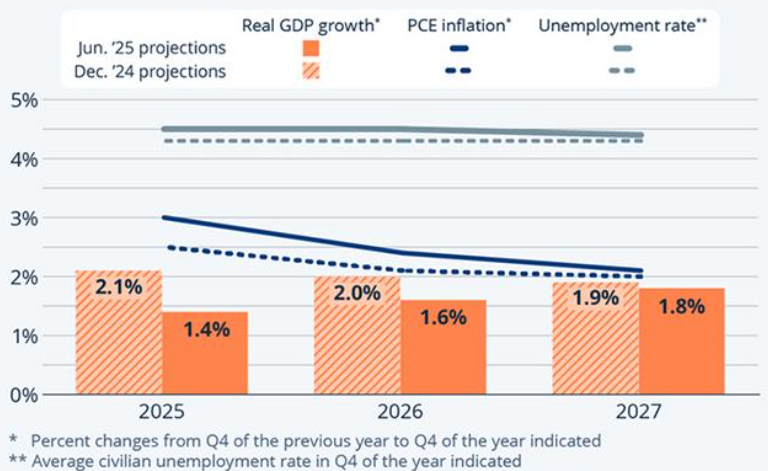
The U.S. inflation outlook for 2027 points toward substantial disinflation compared with the elevated price pressures experienced during 2026, but the path back to the Federal Reserve’s 2 percent objective is unlikely to be completely smooth. The most important official forecasts currently point toward inflation moving closer to target during 2027 as tariff-related price pressures fade, energy markets stabilize, monetary policy remains restrictive enough to moderate demand, and labor-market pressures become more balanced. The Federal Reserve’s June 2026 Summary of Economic Projections places median PCE inflation at 2.3 percent in 2027, compared with 3.6 percent in 2026, while its longer-run projection is 2 percent.


The International Monetary Fund (IMF) presents a broadly similar but somewhat more cautious picture. Its April 2026 World Economic Outlook projected U.S. consumer-price inflation at 2.1 percent in 2027, following 3.2 percent in 2026. The IMF’s April 2026 U.S. Article IV assessment also expects core PCE inflation to return to approximately 2 percent during the first half of 2027, although it identifies energy prices and other upside risks as important uncertainties.
The World Bank provides an important global context rather than a directly comparable U.S.-specific inflation target forecast. Its June 2026 Global Economic Prospects expects global conditions to improve during 2027–28 as energy supplies recover, inflation and uncertainty recede, and financial conditions ease. However, the institution also emphasizes that energy shocks, geopolitical tensions and commodity-market disruptions could continue generating inflationary pressure.
Federal Reserve Forecast: Inflation Moves Toward 2 Percent
The Federal Reserve’s projections provide perhaps the clearest benchmark for assessing the 2027 U.S. inflation forecast. In its June 2026 projections, the median forecast for PCE inflation is 2.3 percent in 2027, compared with 3.6 percent in 2026 and 2.0 percent in 2028. The central tendency for 2027 ranges from 2.2 percent to 2.5 percent, while the full participant range extends from 1.9 percent to 2.8 percent.
That forecast suggests that the Federal Reserve expects most of the inflation problem to be resolved during 2027 rather than immediately. Importantly, PCE inflation is the Fed’s preferred broad measure of consumer inflation, meaning its 2.3 percent projection should not be interpreted as a direct forecast for the Consumer Price Index. CPI and PCE can differ because they use different methodologies and expenditure weights.
The Fed’s forecast also implies an important monetary-policy transition. Its June projections place the median federal funds rate at 3.6 percent at the end of 2027, down from 3.8 percent at the end of 2026. This combination—falling inflation and gradually lower interest rates—would be consistent with a soft-landing environment in which monetary policy becomes less restrictive as price pressures moderate.
IMF Forecast: Core Inflation Could Reach 2 Percent in Early 2027
The IMF’s 2026 assessment provides an especially useful explanation for why inflation could decline during 2027. According to the IMF’s U.S. Article IV report, tariff-related inflationary effects are expected to diminish, allowing core PCE inflation to fall back to approximately 2 percent during the first half of 2027. The IMF nevertheless warns that headline inflation could remain somewhat higher because of movements in global oil prices.
This distinction between core and headline inflation is critical. Core inflation excludes food and energy because those categories can fluctuate sharply, while headline inflation includes them. If oil prices rise because of geopolitical disruptions, headline inflation could temporarily remain above the underlying trend even if domestic wage growth, rents and service prices are moderating.
The IMF’s April 2026 data also forecast U.S. average consumer-price inflation at 3.2 percent in 2026 and 2.1 percent in 2027. In other words, the IMF sees inflation moving very close to the Federal Reserve’s 2 percent objective by 2027.
World Bank Perspective: Energy Prices Remain a Major Risk
The World Bank’s analysis adds an important external dimension to the U.S. inflation outlook for 2027. Its June 2026 Global Economic Prospects argues that advanced-economy growth is being affected by higher energy prices, inflation, constrained energy supplies and tighter monetary conditions. At the same time, the World Bank expects energy supplies to recover over 2027–28, with inflation and uncertainty receding and financial conditions gradually easing.
For the United States, this means the inflation trajectory will depend not only on domestic demand but also on developments in global commodity markets. The U.S. economy is relatively large and diversified, but changes in crude oil, natural gas, transportation and other commodity prices can still affect household purchasing power and business costs.
The World Bank also highlights geopolitical risks. Its June outlook identifies prolonged disruptions to energy markets as a potential source of higher inflation and weaker global growth. Consequently, the most plausible 2027 scenario is not necessarily one of perfectly stable 2 percent inflation, but rather inflation that averages near target while remaining vulnerable to temporary external shocks.
Tariffs and the 2027 Inflation Path
One of the most important factors separating the 2027 outlook from the inflation environment of 2025–26 is the expected fading of tariff-related price effects. The Federal Reserve reported that inflation had moved higher as tariff increases pushed up prices for some consumer goods. The IMF similarly concluded that the inflationary impact of tariffs should wane as their pass-through to consumer prices is completed.
This creates a potentially favorable base effect for 2027. If tariffs raise the price level during one period but do not continue accelerating afterward, their contribution to the annual inflation rate can diminish. That does not mean consumers necessarily see prices return to earlier levels; rather, it means prices may increase more slowly.
This distinction is essential for households and businesses. Disinflation does not mean deflation. A decline from 3.5 percent inflation to 2 percent inflation means prices are still rising, simply at a slower pace. Consequently, the cumulative increase in the price level since the pandemic will remain an important economic issue even after the annual inflation rate approaches the Federal Reserve’s target.
Labor Markets and Services Inflation
Another critical variable for 2027 will be services inflation. Goods prices can respond relatively quickly to supply-chain normalization and changes in trade policy, whereas services prices are often more closely linked to wages, housing costs, insurance, healthcare and domestic demand.
The IMF expects U.S. employment growth to slow compared with the unusually strong pace of the years before the pandemic, while the unemployment rate is expected to remain near 4 percent in 2026–27. A labor market that remains healthy but less overheated would be favorable for disinflation because wage pressures could moderate without producing a severe employment contraction.
This is the foundation of the soft-landing scenario. If productivity continues improving while wage growth moderates gradually, businesses may be able to absorb higher labor costs without passing the entire increase to consumers. Conversely, renewed labor shortages or unexpectedly strong demand could make service-sector inflation more persistent.
The Main Risks to the 2027 Inflation Forecast
Although the baseline outlook is favorable, the official forecasts emphasize considerable uncertainty. The Federal Reserve’s historical forecast-error analysis indicates a wide potential range around inflation projections. Its estimated historical error range for total consumer prices in 2027 is approximately ±1.6 percentage points, illustrating why point forecasts should not be treated as precise predictions.
The major upside risks include another energy shock, renewed geopolitical conflict, stronger-than-expected consumer demand, persistent housing costs, renewed wage pressure and additional tariff increases. The IMF specifically identifies global energy prices as an upside inflation risk for the United States.
There are also downside risks. A sharper-than-expected slowdown in U.S. economic activity, weaker global demand, falling commodity prices or faster productivity growth could push inflation below the Federal Reserve’s target. The World Bank’s expectation that global inflation and uncertainty will recede during 2027–28 supports the possibility of a relatively benign external inflation environment.
2027 U.S. Inflation Forecast: Overall Assessment
Taken together, the Federal Reserve, IMF and World Bank outlooks point toward a significant improvement in U.S. inflation during 2027. The Fed’s 2.3 percent PCE inflation projection, the IMF’s 2.1 percent consumer-price forecast and its expectation that core PCE could reach approximately 2 percent in the first half of the year all indicate that inflation is likely to move substantially closer to the Federal Reserve’s long-run objective.
The most likely 2027 environment will be moderate inflation near, but not necessarily exactly at, 2 percent, combined with gradually less restrictive monetary policy. The biggest threat to this outlook is an external energy or geopolitical shock rather than a broad-based reacceleration of domestic inflation. The central question for investors, businesses and households will therefore shift from whether inflation is declining to whether it can remain sustainably close to target.
Ultimately, 2027 could represent an important transition point for the U.S. economy. If tariff effects fade, labor-market conditions remain balanced, productivity continues improving and global energy markets stabilize, the United States could enter a period of relatively stable prices and lower interest rates. If those assumptions fail, however, inflation could remain above target and force the Federal Reserve to maintain restrictive monetary policy for longer.
Key 2027 Inflation Indicators at a Glance
| Institution | 2026 Outlook | 2027 Outlook | Key Message |
|---|---|---|---|
| Federal Reserve | 3.6% PCE | 2.3% PCE | Inflation moves substantially closer to 2% |
| IMF | 3.2% consumer prices | 2.1% consumer prices | Near-target inflation by 2027 |
| IMF — Core PCE | Elevated | Around 2% by H1 2027 | Core inflation normalizes |
| World Bank | Inflation elevated by energy shock | Inflation expected to recede globally | Energy normalization supports disinflation |
Source note: The measures are not perfectly interchangeable. The Federal Reserve’s projection uses PCE inflation, while the IMF’s 2.1 percent figure is based on U.S. consumer prices. The World Bank’s contribution is primarily its global macroeconomic and commodity-market assessment.
For more reading, visit

Economics
U.S. National Debt Surpasses $40 Trillion for the First Time: What It Means for the Economy


U.S. Inflation Outlook for 2027

S&P 500 September Outlook: Tech Rally Holds Index at 7,600

India Unveils ‘Saptadhara’ Reform Agenda Targeting Technology, Youth Skilling, and Growth

Armanino adds Strategic Accounting Outsourced Solutions

New 2023 K-1 instructions stir the CAMT pot for partnerships and corporations

Tax Strategy: Employee Retention Credit update
-

 Technology1 week ago
AI Infrastructure Boom Hits Physical Limits: Power, Financing, and Supply Chain Strain
-
 Stock News3 days ago
S&P 500 September Outlook: Tech Rally Holds Index at 7,600
-

 Economics1 week ago
U.S.- Canada Trade Talks Collapse; Carney Says Retaliatory Tariffs Begin September 8
-
 Finance3 days ago
S&P 500 Outperforms Amid Strong Corporate Earnings as Treasury Yields Cap Equity Multiples
-

 Technology1 week ago
Flock Cameras and the Future of Public Security
-

 Insights3 days ago
Climate Resilience and Offshore Wind and Land Restoration Milestones
-

 Accounting3 days ago
Mandatory ESG Reporting Standards Demand Standardized Non-Financial Audit Trails
-
 Leaders3 days ago
India Unveils ‘Saptadhara’ Reform Agenda Targeting Technology, Youth Skilling, and Growth