
Economics
California is gripped by economic problems, with no easy fix


HOME TO MANY of America’s most progressive policies, from criminal justice to vehicle emissions, California serves a unique role as a punchbag for right-wing politicians. Every few years it becomes fashionable to declare that it is a failed state, or that the California dream is turning into a nightmare. This rhetoric is often overblown: in terms of pure economic heft California remains the most powerful American state. But for all its continuing prowess in innovation (not least in artificial intelligence), California again appears to be entering one of its periodic rough patches.
The state faces three overlapping challenges: rising unemployment, growing fiscal strains and population outflows. All of these should abate over time, but for now they mark out California as a pocket of relative weakness in an otherwise robust American economy.

When the Federal Reserve jacked up interest rates in 2022 in order to tame inflation, many analysts and investors fretted that this monetary tightening would lead to a recession. Instead, the broader economy has been surprisingly resilient. The national unemployment rate remains less than 4%, within spitting distance of a six-decade low. In California, by contrast, the unemployment rate has shot up to 5.3%, the highest of any state (see chart 1).
On its surface the reason for the rise in joblessness in California is no bad thing: as the aftershocks of the covid pandemic fade away, more people are actively seeking jobs. Until they find work, they show up in official data as unemployed. The deeper problem is that the state does not have enough work for them. In California there are roughly 0.8 job openings per unemployed person—the lowest in the country—whereas in America’s other 49 states the overall ratio is 1.6. On Indeed, a recruitment website, California is one of only a handful of states to have suffered a decline in job postings since the eve of the pandemic. Tech firms, which had hired aggressively during the long period of low interest rates, are now retrenching. Silicon Valley’s downsizing has seeped into other parts of the Californian economy, with transport, financial and manufacturing companies all shedding workers.
The Legislative Analyst’s Office (LAO), a nonpartisan fiscal adviser for California’s legislature, last autumn pointed to the rise in unemployment as a potential signal of a recession in the state. The LAO’s judgment matters because it focuses on the state’s fiscal picture, which appears to be badly frayed. Last year California’s income-tax collection tumbled by 25%, similar to falls during the global financial crisis of 2007-09 and the dotcom bust of the early 2000s.
Weakness has persisted. In his budget for the new fiscal year, which begins on July 1st, Gavin Newsom, California’s governor, projected that the state’s deficit would hit $38bn. But the LAO estimates that it is instead on track to hit $73bn. A slightly different methodology accounts for roughly half of that discrepancy, but however the numbers are sliced, California’s constitution requires a balanced budget and it must find a way to close its fiscal hole.
The state has built up a rainy-day fund over the past decade, but Mr Newsom’s proposed budget will draw down roughly half of it. Other solutions have involved deferring promised funding—for universities, the homeless and the disabled. That, however, will only add to shortfalls in the near future, when the LAO projects continued deficits. “It might be easier to tell various stakeholders that the money has just been delayed, but the reality is much of it needs to be eliminated,” says Gabriel Petek, head of the LAO.
As for the outflow of Californians—the third worry—it is not new. Since the early 1990s Californians moving out have usually outnumbered other Americans moving in. But the impact of this out-migration has become more serious. In the past immigrants from abroad more than made up for the domestic outflows, such that California’s population continued to grow. The slowdown in international arrivals during the covid pandemic changed that dynamic. California has recorded an outright decline in its population for three straight years, the first sustained drop since 1850, the year it became a state.

From a fiscal standpoint, the damage has been compounded by the wealth of those leaving. California has lost a steadily growing number of high-earning residents, with the trend accelerating at the height of covid. In 2021 California lost nearly $30bn in net taxpayer income to other states, amounting to about 2% of its tax base. And given its reliance on capital-gains taxes as a big, if volatile, source of revenue, departures of the wealthy may hurt its future fiscal position. Taken together these outflows limit the state’s flexibility in fixing its budget mess. Raising taxes would be one possible solution but doing so may just drive more rich Californians to leave.
As it stands, the overall tax burden on Californians is the fifth-highest in the country, according to the Tax Foundation, a think-tank. The one area where the state’s tax revenues are low—absurdly so—is on property because of a law, passed by popular vote in 1978, which has led to homes being assessed well below their market value. That in turn contributes to inflated housing prices in California, pushing yet more people away from the state.
Golden handcuffs
It is salutary to remember that California has experienced worse. In the early 1990s, reeling from a deep recession, more than 1m Californians left for other states. In 2000-01 a grossly mismanaged electricity market (plus Enron’s corruption) led to blackouts. In 2009 California began paying IOUs to businesses, students and taxpayers to whom it owed money. California’s unemployment rate tends to run a little higher than the rest of America’s. This partly reflects the churn of its tech sector, with firms expanding rapidly but also, when times are tough, pulling back sharply. Throughout California’s many brushes with economic trouble, its innovation-led growth model has been remarkably resilient. The state accounted for about 14% of America’s total output last year, up from 12.5% in the late 1990s (see chart 2).
“People are always judging us on past metrics. So they’re looking at what’s receding, and not enough at what is emerging,” says Dee Dee Myers, a senior adviser to the governor. She points to rising stars across different parts of the state: AI, quantum computing, space tech, immunotherapy, electric vehicles and more. California’s entrenched strengths include the largest higher-education system in the country, more national laboratories than any other state, a location that makes it the gateway for a third of America’s foreign trade and—rumour has it—some pretty nice beaches and mountains. “I also think it’s the culture of California, which often gets maligned. It’s not an accident that all these new ideas are happening here,” says Ms Myers.
Another transition is under way, with more of California’s population and, by extension, economy shifting inland. Among people who left the two biggest Bay Area cities (San Jose and San Francisco) between 2016 and 2020, five of their six most popular destinations were within California, not to other states, according to Oxford Economics, a research firm. Two of the winners were Sacramento and Stockton in the Central Valley, both less than three hours by car from San Francisco. That is spreading tech expertise more widely. “If you’ve got the talent elsewhere and you don’t need to be in San Francisco, why would you build a factory there? You can build in the greater San Francisco area, where land is much cheaper,” says Jerry Nickelsburg of UCLA.
Yet the inland migration by itself is not enough to solve California’s problems. A recent research paper by the Hoover Institution, a conservative think-tank, counted 352 firms that had moved their headquarters to other states in the four years to the end of 2021. A bevy of cost factors were, it argued, pushing them out: high taxes, high energy prices and high wages. Lee Ohanian, one of the report’s authors, thinks more of the same—a steady decay, not a crash—is in store for California’s economy. “The more you have this insidious drop, the tougher it becomes for the state government,” he says. “We have hit the wall where we really can’t get any more tax revenue without significantly damaging the economy.”
One fulcrum that could dramatically alter California’s fortunes is the property market. Housing has become more unaffordable throughout America over the past decade but California continues to claim the dubious crown as the least affordable big state. The price-to-income ratio for buying homes is 12 in San Jose and 11.3 in San Francisco, double the national median, according to researchers at Harvard University. The root cause is a lack of new housing. Mr Newsom is well aware of this and has sought to kick-start construction. Since 2017 lawmakers have passed more than 100 separate pieces of legislation to make it easier to build homes. But the results have been dismal so far. Construction permits have plateaued at about 110,000 housing units per year, far short of what California needs.
Instead, the property sector stands as an example of how California often ties itself in regulatory knots. The state has sped up its notoriously cumbersome environmental reviews for housing, especially for affordable projects. Yet to benefit from this provision, companies must demonstrate that they are using highly skilled workers at prevailing wages—a requirement that in practice compels them to hire union contractors. Alexis Gevorgian, a developer, calculates that this can increase costs by as much as 40%, turning affordable housing into a guaranteed loss-making venture. “The expedited reviews themselves are useless unless you get a subsidy from the government,” Mr Gevorgian says. One of the things on the chopping block as California looks to close its budget deficit? About $1bn of funding for affordable housing, including subsidies for developers. California is no failed state. But it certainly is a struggling one. ■

Economics
U.S. National Debt Surpasses $40 Trillion for the First Time: What It Means for the Economy



Executive Summary & Core Macro Outlook
The United States enters the 2026–2030 macroeconomic window as the unquestioned heavyweight of nominal economic output, retaining its status as the primary engine of global financial liquidity, private enterprise innovation, and high-margin technological deployment. According to multi-year projections from the International Monetary Fund (IMF) World Economic Outlook and complementary datasets from the World Bank, the US nominal Gross Domestic Product (GDP) is projected to reach $32.38 trillion by 2026, accounting for approximately 25% of global nominal output and roughly 14.5% of world GDP measured at Purchasing Power Parity (PPP).
Unlike many of its advanced-economy peers across Western Europe and East Asia—which are grappling with acute demographic contraction and structural energy shocks—the United States demonstrates remarkable macroeconomic resilience. The IMF projects a real GDP Compound Annual Growth Rate (CAGR) of 2.1% to 2.3% through 2030. This expansion is sustained by three structural anchors: unmatched capital depth driving massive private-sector investment in Artificial Intelligence (AI) infrastructure, complete energy independence as a net exporter of hydrocarbons and liquefied natural gas (LNG), and high labor productivity gains that cushion the economy against rising debt-servicing costs.
Macroeconomic Data Matrix (2026–2030 Projections)
| Economic Metric | IMF / World Bank Baseline (2026–2030) | Global Benchmark & Context |
| Nominal GDP (2026 Projection) | ~$32.38 Trillion | Rank #1 Globally |
| GDP at Purchasing Power Parity (PPP) | ~$32.40 Trillion | Rank #2 Globally (Behind China’s ~$38.5T PPP) |
| Projected Real GDP CAGR (2026–2030) | 2.1% – 2.3% | Top decile among G7 advanced economies |
| Gross Public Debt (% of GDP) | ~122.5% – 128.0% | Structural fiscal deficit trajectory |
| Core Inflation Rate (PCE Target) | Stabilizing at 2.0% – 2.2% | Federal Reserve inflation target alignment |
| Current Account Balance (% of GDP) | -2.8% to -3.2% | Persistent capital import & reserve currency demand |
Deep Structural Growth Drivers
1. The AI Infrastructure Hyper-Cycle & TFP Expansion
The defining growth catalyst for the US economy over the 2026–2030 horizon is the unprecedented scale of private capital expenditure (Capex) poured into artificial intelligence infrastructure, enterprise software integration, and advanced computing hardware.
Major technology mega-caps and private equity funds are directing hundreds of billions of dollars annually into hyper-scale data centers, domestic semiconductor fabrication, high-voltage electrical grid upgrades, and AI-driven workflow platforms. According to World Bank economic research, technological adoption across American service and manufacturing sectors is driving a notable uptick in Total Factor Productivity (TFP). This productivity surge allows US companies to expand profit margins and output even in an environment characterized by higher structural real interest rates and tight skilled-labor markets.
2. Deep Capital Markets and Private Sector Liquidity
The structural backbone of US economic outperformance remains its financial system. US capital markets represent over 40% of global equity market capitalization and a vast majority of global venture capital and private credit assets.
This liquidity creates an efficient mechanism for capital allocation: high-potential emerging industries (such as quantum computing, synthetic biology, and advanced defense technology) receive early-stage funding at a scale that no other national market can match. When global monetary conditions tighten, global capital flees toward safety and yield, reinforcing US capital depth and lowering the relative cost of equity capital for American corporations.
3. Net Energy Independence & Industrial Cost Advantages
Unlike industrial hubs in Germany, Japan, or South Korea—which remain highly vulnerable to volatile sea-lane logistics and imported fuel price spikes—the United States operates as a major net exporter of petroleum, natural gas, and refined chemical products.
Access to abundant, cheap domestic natural gas provides US heavy industry, advanced manufacturing, and electricity-hungry data centers with a persistent structural cost advantage. Furthermore, federal policy frameworks (including the CHIPS and Science Act and clean energy tax provisions) continue to catalyze domestic private manufacturing investment, re-shoring high-value supply chains from East Asia back to the American Sunbelt and Midwest.
Macroeconomic Vulnerabilities & Downside Risks
1. Structural Sovereign Debt Trajectory
The most significant medium-term threat to US macroeconomic stability is the path of federal public debt. With gross national debt exceeding 120% of GDP and annual federal deficits running between 5% and 7% of GDP, the US fiscal baseline faces increasing structural pressure.
As older legacy low-yield Treasury bonds mature, they are refinanced at higher prevailing interest rates. According to IMF fiscal monitor assessments, federal net interest payments are absorbing an expanding share of total fiscal revenue, crowding out discretionary spending and narrowing the government’s capacity to deploy counter-cyclical fiscal stimulus during future downturns.
2. Commercial Real Estate (CRE) & Banking Sector Realignment
The structural transformation toward hybrid work models has permanently altered office space utilization across major US metropolitan areas. Regional and community banks, which hold a disproportionate share of commercial real estate debt, face ongoing balance-sheet pressure as legacy office loans mature and require refinancing at lower property valuations and higher interest rates. While systemic money-center banks remain well-capitalized, localized credit tightening from regional lenders presents a headwind for small-and-medium enterprise (SME) borrowing.
High-Outperformance Sector Matrix (2026–2030)
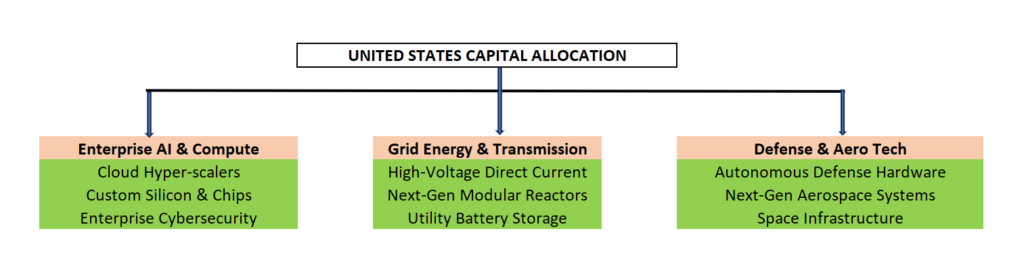
- Enterprise AI, Cloud Compute, & Cybersecurity: Companies building enterprise-grade software, AI agents, cloud architectures, and specialized hardware protection layers.
- Next-Generation Energy & Grid Modernization: Power generation utilities, high-voltage electrical equipment makers, small modular nuclear reactor (SMR) developers, and energy storage systems catering to exponential data center energy demands.
- Advanced Defense Technology & Aerospace: Autonomous systems, satellite networks, hypersonic defense, and advanced materials supplying both domestic security needs and global allied demand.
Strategic Summary for Global Investors & Executives
The United States through 2030 remains the ultimate high-volume, high-yield destination for institutional capital. While fiscal debt risks require long-term monitoring, the immediate 5-year outlook is defined by strong technology-driven productivity, resilient private consumption, and unmatched market liquidity. For global corporations and institutional allocators, exposure to the US economy remains an indispensable pillar of long-term growth strategy.
Top 65 Largest Economies in the World for 2027
Top 10 Largest Economies by 2030: IMF & World Bank GDP Projections for Global Powerhouses

U.S.- Canada Trade Talks Collapse; Carney Says Retaliatory Tariffs Begin September 8

Flock Cameras and the Future of Public Security

AI Infrastructure Boom Hits Physical Limits: Power, Financing, and Supply Chain Strain

Armanino adds Strategic Accounting Outsourced Solutions

New 2023 K-1 instructions stir the CAMT pot for partnerships and corporations

Tax Strategy: Employee Retention Credit update
-

 Stock News1 week ago
Nvidia Earnings Preview: What Wall Street Expects From the AI Bellwether’s Q2 Report
-

 Accounting1 week ago
SEC’s Semiannual Reporting Proposal Faces Investor Pushback: What CFOs Need to Know
-

 Stock News1 week ago
Nvidia Q2 FY2027 Earnings beats Wall Street Expectation with Record $96.2 Billion Revenue
-

 Finance1 week ago
Treasury Bond Volatility Forces Bessent to Double Debt Buyback Size as Yields Swing
-
 Technology5 days ago
AI Infrastructure Boom Hits Physical Limits: Power, Financing, and Supply Chain Strain
-
 Technology2 days ago
Flock Cameras and the Future of Public Security
-
 Economics2 days ago
U.S.- Canada Trade Talks Collapse; Carney Says Retaliatory Tariffs Begin September 8