
Economics
Why inflation may look like it’s easing but is still a huge problem


A family shops for Halloween candy at a Walmart Supercenter on October 16, 2024 in Austin, Texas.
Brandon Bell | Getty Images
Just because the Federal Reserve is nearing its inflation goal doesn’t mean the problem is solved, as the high price of goods and services across the U.S. economy continues to pose a burden for individuals, businesses and policymakers.
Recent price reports on goods and services, despite being a bit stronger than expected, indicate that the rate of inflation over the past year is getting close to the central bank’s 2% target.
In fact, Goldman Sachs recently estimated that when the Bureau of Economic Analysis later this month releases its figures on the Fed’s favorite price measure, the inflation rate could be close enough to get rounded down to that 2% level.
But inflation is a mosaic. It can’t be captured fully by any individual yardstick, and by many metrics is still well above where most Americans, and in fact some Fed officials, feel comfortable.
Sounding like many of her colleagues, San Francisco Fed President Mary Daly last Tuesday touted the easing of inflation pressures but noted that the Fed isn’t declaring victory nor is it eager to rest on its laurels.
“Continued progress towards our goals is not guaranteed, so we must stay vigilant and intentional,” she told a group gathered at the New York University Stern School of Business.
Inflation is not dead
Daly began her talk with an anecdote of a recent encounter she had while walking near her home. A young man pushing a stroller and walking a dog called out, “President Daly, are you declaring victory?” She assured him she was not waving any banners when it comes to inflation.
But the conversation encapsulated a dilemma for the Fed: If inflation is on the run, why are interest rates still so high? Conversely, if inflation still hasn’t been whipped — those who were around in the 1970s might remember the “Whip Inflation Now” buttons — why is the Fed cutting at all?
In Daly’s eyes, the Fed’s half percentage point reduction in September was an attempt at “right-sizing” policy, to bring the current rate climate in line with inflation that is well off its peak of mid-2022 at the same time as there are signs the labor market is softening.
As evidenced by the young man’s question, convincing people that inflation is easing is a tough sell.
When it comes to inflation, there are two things to remember: the rate of inflation, which is the 12-month view that garners headlines, and the cumulative effects that a more than three-year run has had on the economy.
Looking at the 12-month rate provides only a limited view.

The annual rate of CPI inflation was 2.4% in September, a vast improvement over the 9.1% top in June 2022. The CPI measure draws the bulk of public focus but is secondary to the Fed, which prefers the personal consumption expenditures price index from the Commerce Department. Taking the inputs from the CPI that feed into the PCE measure led Goldman to its conclusion that the latter measure is just a few hundredths of a percentage point from 2%.
Inflation first passed the Fed’s 2% objective in March 2021 and for months was dismissed by Fed officials as the “transitory” product of pandemic-specific factors that would soon recede. Fed Chair Jerome Powell, in his annual policy speech at the Jackson Hole, Wyoming summit this August, joked about “the good ship Transitory” and all the passengers it had in the early days of the inflation run-up.
Obviously, inflation wasn’t transitory, and the all-items CPI reading is up 18.8% since then. Food inflation has surged 22%. Eggs are up 87%, auto insurance has soared almost 47% and gasoline, though on a downward trajectory these days, is still up 16% from then. And, of course, there’s housing: The median home price has jumped 16% since Q1 of 2021 and 30% from the beginning of the pandemic-fueled buying frenzy.
Finally, while some broad measures of inflation such as CPI and PCE are pulling back, others show stubbornness.
For instance, the Atlanta Fed’s measure of “sticky price” inflation — think rent, insurance and medical care — was still running at a 4% rate in September even as “flexible CPI,” which includes food, energy and vehicle costs, was in outright deflation at -2.1%. That means that prices that don’t change a lot are still high, while those that do, in this particular case gasoline, are falling but could turn the other way.
The sticky-price measure also brings up another important point: “Core” inflation that excludes food and energy prices, which fluctuate more than other items, was still at 3.3% in September by the CPI measure and 2.7% in August as gauged by the PCE index.
While Fed officials lately have been talking more about headline numbers, historically they’ve considered core a better measure of long-run trends. That makes the inflation data even more troublesome.
Borrowing to pay higher prices
Prior to the 2021 spike, American consumers had grown accustomed to negligible inflation. Even so, during the current run, they have continued to spend, spend and spend some more despite all the grumbling about the soaring cost of living.
In the second quarter, consumer spending equaled close to $20 trillion at an annualized pace, according to the Bureau of Economic Analysis. In September, retail sales increased a larger-than-expected 0.4%, with the group that feeds directly into gross domestic product calculations up 0.7%. However, year-over-year spending increased just 1.7%, below the 2.4% CPI inflation rate.
A growing portion of spending has come through IOUs of various forms.
Household debt totaled $20.2 trillion through the second quarter of this year, up $3.25 trillion, or 19%, from when inflation started spiking in Q1 of 2021, according to Federal Reserve data. In the second quarter of this year, household debt rose 3.2%, the biggest increase since Q3 of 2022.

So far, the rising debt hasn’t proved to be a major problem, but it’s getting there.
The current debt delinquency rate is at 2.74%, the highest in nearly 12 years though still slightly below the long-term average of around 3% in Fed data going back to 1987. However, a recent New York Fed survey showed that the perceived probability of missing a minimum debt payment over the next three months jumped to 14.2% of respondents, the highest level since April 2020.
And it’s not just consumers who are racking up credit.
Small business credit card usage has continued to tick higher, up more than 20% compared to pre-pandemic levels and nearing the highest in a decade, according to Bank of America. The bank’s economists expect the pressure could ease as the Fed lowers interest rates, though the magnitude of the cuts could come into question if inflation proves sticky.
In fact, the one bright spot of the small business story relative to credit balances is that they actually haven’t kept up with the 23% inflation increase going back to 2019, according to BofA.
Broadly speaking, though, sentiment is downbeat at small firms. The September survey from the National Federation of Independent Business showed that 23% of respondents still see inflation as their main problem, again the top issue for members.
The Fed’s choice
Amid the swirling currents of the good news/bad news inflation picture, the Fed has an important decision to make at its Nov. 6-7 policy meeting.
Since policymakers in September voted to lower their baseline interest rate by half a percentage point, or 50 basis points, markets have acted curiously. Rather than price in lower rates ahead, they’ve begun to indicate a higher trajectory.
The rate on a 30-year fixed mortgage, for instance, has climbed about 40 basis points since the cut, according to Freddie Mac. The 10-year Treasury yield has moved up by a similar amount, and the 5-year breakeven rate, a bond market inflation gauge that measures the 5-year government note against the Treasury Inflation Protected Security of the same duration, has moved up about a quarter point and recently was at its highest level since early July.
SMBC Nikko Securities has been a lone voice on Wall Street encouraging the Fed to take a break from cuts until it can gain greater clarity about the current situation. The firm’s position has been that with stock market prices eclipsing new records as the Fed has shifted into easing mode, softening financial conditions threaten to push inflation back up. (Atlanta Fed President Raphael Bostic recently indicated that a November pause is a possibility he’s considering.)
“For Fed policymakers, lower interest rates are likely to further ease financial conditions, thereby boosting the wealth effect through higher equity prices. Meanwhile, a fraught inflationary backdrop should persist,” SMBC chief economist Joseph LaVorgna, who was a senior economist in the Donald Trump White House, wrote in a note Friday.
That leaves folks like the young man who Daly, the San Francisco Fed president, encountered uneasy about the future and hinting whether the Fed perhaps is making a policy mistake.
“I think we can move towards [a world] where people have time to catch up and then get ahead,” Daly said during her talk in New York. “That is, I told the young father on the sidewalk, my version of victory, and that’s when I will consider the job done.”











Economics
U.S. National Debt Surpasses $40 Trillion for the First Time: What It Means for the Economy



Executive Summary & Core Macro Outlook
The United States enters the 2026–2030 macroeconomic window as the unquestioned heavyweight of nominal economic output, retaining its status as the primary engine of global financial liquidity, private enterprise innovation, and high-margin technological deployment. According to multi-year projections from the International Monetary Fund (IMF) World Economic Outlook and complementary datasets from the World Bank, the US nominal Gross Domestic Product (GDP) is projected to reach $32.38 trillion by 2026, accounting for approximately 25% of global nominal output and roughly 14.5% of world GDP measured at Purchasing Power Parity (PPP).
Unlike many of its advanced-economy peers across Western Europe and East Asia—which are grappling with acute demographic contraction and structural energy shocks—the United States demonstrates remarkable macroeconomic resilience. The IMF projects a real GDP Compound Annual Growth Rate (CAGR) of 2.1% to 2.3% through 2030. This expansion is sustained by three structural anchors: unmatched capital depth driving massive private-sector investment in Artificial Intelligence (AI) infrastructure, complete energy independence as a net exporter of hydrocarbons and liquefied natural gas (LNG), and high labor productivity gains that cushion the economy against rising debt-servicing costs.
Macroeconomic Data Matrix (2026–2030 Projections)
| Economic Metric | IMF / World Bank Baseline (2026–2030) | Global Benchmark & Context |
| Nominal GDP (2026 Projection) | ~$32.38 Trillion | Rank #1 Globally |
| GDP at Purchasing Power Parity (PPP) | ~$32.40 Trillion | Rank #2 Globally (Behind China’s ~$38.5T PPP) |
| Projected Real GDP CAGR (2026–2030) | 2.1% – 2.3% | Top decile among G7 advanced economies |
| Gross Public Debt (% of GDP) | ~122.5% – 128.0% | Structural fiscal deficit trajectory |
| Core Inflation Rate (PCE Target) | Stabilizing at 2.0% – 2.2% | Federal Reserve inflation target alignment |
| Current Account Balance (% of GDP) | -2.8% to -3.2% | Persistent capital import & reserve currency demand |
Deep Structural Growth Drivers
1. The AI Infrastructure Hyper-Cycle & TFP Expansion
The defining growth catalyst for the US economy over the 2026–2030 horizon is the unprecedented scale of private capital expenditure (Capex) poured into artificial intelligence infrastructure, enterprise software integration, and advanced computing hardware.
Major technology mega-caps and private equity funds are directing hundreds of billions of dollars annually into hyper-scale data centers, domestic semiconductor fabrication, high-voltage electrical grid upgrades, and AI-driven workflow platforms. According to World Bank economic research, technological adoption across American service and manufacturing sectors is driving a notable uptick in Total Factor Productivity (TFP). This productivity surge allows US companies to expand profit margins and output even in an environment characterized by higher structural real interest rates and tight skilled-labor markets.
2. Deep Capital Markets and Private Sector Liquidity
The structural backbone of US economic outperformance remains its financial system. US capital markets represent over 40% of global equity market capitalization and a vast majority of global venture capital and private credit assets.
This liquidity creates an efficient mechanism for capital allocation: high-potential emerging industries (such as quantum computing, synthetic biology, and advanced defense technology) receive early-stage funding at a scale that no other national market can match. When global monetary conditions tighten, global capital flees toward safety and yield, reinforcing US capital depth and lowering the relative cost of equity capital for American corporations.
3. Net Energy Independence & Industrial Cost Advantages
Unlike industrial hubs in Germany, Japan, or South Korea—which remain highly vulnerable to volatile sea-lane logistics and imported fuel price spikes—the United States operates as a major net exporter of petroleum, natural gas, and refined chemical products.
Access to abundant, cheap domestic natural gas provides US heavy industry, advanced manufacturing, and electricity-hungry data centers with a persistent structural cost advantage. Furthermore, federal policy frameworks (including the CHIPS and Science Act and clean energy tax provisions) continue to catalyze domestic private manufacturing investment, re-shoring high-value supply chains from East Asia back to the American Sunbelt and Midwest.
Macroeconomic Vulnerabilities & Downside Risks
1. Structural Sovereign Debt Trajectory
The most significant medium-term threat to US macroeconomic stability is the path of federal public debt. With gross national debt exceeding 120% of GDP and annual federal deficits running between 5% and 7% of GDP, the US fiscal baseline faces increasing structural pressure.
As older legacy low-yield Treasury bonds mature, they are refinanced at higher prevailing interest rates. According to IMF fiscal monitor assessments, federal net interest payments are absorbing an expanding share of total fiscal revenue, crowding out discretionary spending and narrowing the government’s capacity to deploy counter-cyclical fiscal stimulus during future downturns.
2. Commercial Real Estate (CRE) & Banking Sector Realignment
The structural transformation toward hybrid work models has permanently altered office space utilization across major US metropolitan areas. Regional and community banks, which hold a disproportionate share of commercial real estate debt, face ongoing balance-sheet pressure as legacy office loans mature and require refinancing at lower property valuations and higher interest rates. While systemic money-center banks remain well-capitalized, localized credit tightening from regional lenders presents a headwind for small-and-medium enterprise (SME) borrowing.
High-Outperformance Sector Matrix (2026–2030)
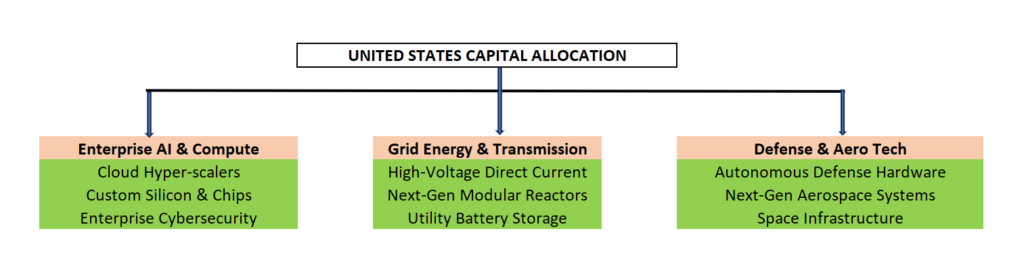
- Enterprise AI, Cloud Compute, & Cybersecurity: Companies building enterprise-grade software, AI agents, cloud architectures, and specialized hardware protection layers.
- Next-Generation Energy & Grid Modernization: Power generation utilities, high-voltage electrical equipment makers, small modular nuclear reactor (SMR) developers, and energy storage systems catering to exponential data center energy demands.
- Advanced Defense Technology & Aerospace: Autonomous systems, satellite networks, hypersonic defense, and advanced materials supplying both domestic security needs and global allied demand.
Strategic Summary for Global Investors & Executives
The United States through 2030 remains the ultimate high-volume, high-yield destination for institutional capital. While fiscal debt risks require long-term monitoring, the immediate 5-year outlook is defined by strong technology-driven productivity, resilient private consumption, and unmatched market liquidity. For global corporations and institutional allocators, exposure to the US economy remains an indispensable pillar of long-term growth strategy.
Top 65 Largest Economies in the World for 2027
Top 10 Largest Economies by 2030: IMF & World Bank GDP Projections for Global Powerhouses

U.S.- Canada Trade Talks Collapse; Carney Says Retaliatory Tariffs Begin September 8

Flock Cameras and the Future of Public Security

AI Infrastructure Boom Hits Physical Limits: Power, Financing, and Supply Chain Strain

Armanino adds Strategic Accounting Outsourced Solutions

New 2023 K-1 instructions stir the CAMT pot for partnerships and corporations

Tax Strategy: Employee Retention Credit update
-

 Stock News1 week ago
Nvidia Earnings Preview: What Wall Street Expects From the AI Bellwether’s Q2 Report
-
 Accounting1 week ago
SEC’s Semiannual Reporting Proposal Faces Investor Pushback: What CFOs Need to Know
-

 Finance1 week ago
Treasury Bond Volatility Forces Bessent to Double Debt Buyback Size as Yields Swing
-

 Stock News1 week ago
Nvidia Q2 FY2027 Earnings beats Wall Street Expectation with Record $96.2 Billion Revenue
-
 Technology4 days ago
AI Infrastructure Boom Hits Physical Limits: Power, Financing, and Supply Chain Strain
-
 Economics2 days ago
U.S.- Canada Trade Talks Collapse; Carney Says Retaliatory Tariffs Begin September 8
-
 Technology2 days ago
Flock Cameras and the Future of Public Security