
Economics
How wrong could America’s pollsters be?


DESPITE POLLS being in essence tied, gamblers betting on the outcome of America’s presidential election are increasingly confident that Donald Trump, the Republican nominee, will win. Polymarket, a prediction market that has seen over $2.6bn traded on the election, gives him a two-in-three chance. Bettors are in effect gambling that polls are underestimating him for the third time in a row.

Such an error is certainly possible. Polling averages show Kamala Harris or Mr Trump leading in each of the seven swing states by a smaller margin than a normal polling error (see chart). Democrats fear there will be a repeat of the substantial polling misses of 2016 and 2020, when Mr Trump did better than expected. But there is no guarantee that the error will be in the same direction this year: pollsters have gone to great lengths to account for previous mistakes. As The Economist’s presidential forecast quantifies, based on historical polling errors, a broad range of results are possible on election day—but polls remain the best indication of how people intend to vote.
Opinion polling works by surveying a representative sample of voters. Errors can arise in a number of ways. There is normal statistical variation, which affects all polls, especially those with a small sample size. There is the risk of last-minute swings or unexpected turnout patterns. And there is the biggest headache for pollsters—ensuring their sample is representative. Researchers work hard to do this: finding new ways of reaching voters, incentivising respondents from certain demographic groups and using “weights” to increase the relative importance of underrepresented groups.
FiveThirtyEight, a data-journalism outfit, has calculated polling averages for presidential elections going back to 1976. On average, the size of the gap between the polls’ findings and the actual margin of victory is 2.7 percentage points nationwide and 4.2 points in individual states. FiveThirtyEight currently estimates that the largest lead for either candidate in the seven swing states is just 2.0 points, for Mr Trump in Arizona.
Infamously, polls in 2016 and 2020 systematically underestimated Mr Trump’s vote, especially in battleground states. After the 2016 election, the post mortem conducted by AAPOR, a professional organisation of pollsters, pointed to a late swing towards the Republican nominee and overrepresentation of graduates in poll samples. Most firms began to weight their samples to do a better job of reflecting the education profile of voters.
In 2020 the underestimation of Mr Trump was repeated for different reasons. This time AAPOR identified non-response bias—Republican voters were less likely to respond to pollsters. One theory is that they were less likely to be at home during the covid-19 pandemic (twiddling their thumbs and responding to surveys). Another is that Republican voters distrust pollsters, which discourages them from answering surveys.
Since 2020 pollsters have been at pains to reach a representative sample. They have experimented with recruitment that appeals to certain sections of society (postcards plastered with patriotic imagery, for example) and new modes, such as text messages. It is anyone’s guess whether this will be enough to account for the Democratic bias in response rates or whether supporters of Mr Trump are still reluctant to answer polls. If the errors seen in 2020 or 2016 are repeated even to a small degree that would be disastrous for Ms Harris—she could lose all seven swing states.
Democrats aiming to soothe their anxieties may refer to a wider historical lens. It is true that there is a slight correlation between the polling error in a state at one election and the error in the next. That suggests that Mr Trump is more likely to outperform the polls than Ms Harris is. But the relationship is weak and not very useful for predicting election results. There are also plenty of plausible scenarios in which polls underestimate support for Ms Harris. For example, the errors in 2020 could have been pandemic-specific. Pollsters may have since overcorrected for them. Polls, with all their uncertainties, remain the most useful indicator of public opinion. Without them we would not be able to say with such confidence that the outcome of the election is a toss-up. ■













Economics
U.S. National Debt Surpasses $40 Trillion for the First Time: What It Means for the Economy



Executive Summary & Core Macro Outlook
The United States enters the 2026–2030 macroeconomic window as the unquestioned heavyweight of nominal economic output, retaining its status as the primary engine of global financial liquidity, private enterprise innovation, and high-margin technological deployment. According to multi-year projections from the International Monetary Fund (IMF) World Economic Outlook and complementary datasets from the World Bank, the US nominal Gross Domestic Product (GDP) is projected to reach $32.38 trillion by 2026, accounting for approximately 25% of global nominal output and roughly 14.5% of world GDP measured at Purchasing Power Parity (PPP).
Unlike many of its advanced-economy peers across Western Europe and East Asia—which are grappling with acute demographic contraction and structural energy shocks—the United States demonstrates remarkable macroeconomic resilience. The IMF projects a real GDP Compound Annual Growth Rate (CAGR) of 2.1% to 2.3% through 2030. This expansion is sustained by three structural anchors: unmatched capital depth driving massive private-sector investment in Artificial Intelligence (AI) infrastructure, complete energy independence as a net exporter of hydrocarbons and liquefied natural gas (LNG), and high labor productivity gains that cushion the economy against rising debt-servicing costs.
Macroeconomic Data Matrix (2026–2030 Projections)
| Economic Metric | IMF / World Bank Baseline (2026–2030) | Global Benchmark & Context |
| Nominal GDP (2026 Projection) | ~$32.38 Trillion | Rank #1 Globally |
| GDP at Purchasing Power Parity (PPP) | ~$32.40 Trillion | Rank #2 Globally (Behind China’s ~$38.5T PPP) |
| Projected Real GDP CAGR (2026–2030) | 2.1% – 2.3% | Top decile among G7 advanced economies |
| Gross Public Debt (% of GDP) | ~122.5% – 128.0% | Structural fiscal deficit trajectory |
| Core Inflation Rate (PCE Target) | Stabilizing at 2.0% – 2.2% | Federal Reserve inflation target alignment |
| Current Account Balance (% of GDP) | -2.8% to -3.2% | Persistent capital import & reserve currency demand |
Deep Structural Growth Drivers
1. The AI Infrastructure Hyper-Cycle & TFP Expansion
The defining growth catalyst for the US economy over the 2026–2030 horizon is the unprecedented scale of private capital expenditure (Capex) poured into artificial intelligence infrastructure, enterprise software integration, and advanced computing hardware.
Major technology mega-caps and private equity funds are directing hundreds of billions of dollars annually into hyper-scale data centers, domestic semiconductor fabrication, high-voltage electrical grid upgrades, and AI-driven workflow platforms. According to World Bank economic research, technological adoption across American service and manufacturing sectors is driving a notable uptick in Total Factor Productivity (TFP). This productivity surge allows US companies to expand profit margins and output even in an environment characterized by higher structural real interest rates and tight skilled-labor markets.
2. Deep Capital Markets and Private Sector Liquidity
The structural backbone of US economic outperformance remains its financial system. US capital markets represent over 40% of global equity market capitalization and a vast majority of global venture capital and private credit assets.
This liquidity creates an efficient mechanism for capital allocation: high-potential emerging industries (such as quantum computing, synthetic biology, and advanced defense technology) receive early-stage funding at a scale that no other national market can match. When global monetary conditions tighten, global capital flees toward safety and yield, reinforcing US capital depth and lowering the relative cost of equity capital for American corporations.
3. Net Energy Independence & Industrial Cost Advantages
Unlike industrial hubs in Germany, Japan, or South Korea—which remain highly vulnerable to volatile sea-lane logistics and imported fuel price spikes—the United States operates as a major net exporter of petroleum, natural gas, and refined chemical products.
Access to abundant, cheap domestic natural gas provides US heavy industry, advanced manufacturing, and electricity-hungry data centers with a persistent structural cost advantage. Furthermore, federal policy frameworks (including the CHIPS and Science Act and clean energy tax provisions) continue to catalyze domestic private manufacturing investment, re-shoring high-value supply chains from East Asia back to the American Sunbelt and Midwest.
Macroeconomic Vulnerabilities & Downside Risks
1. Structural Sovereign Debt Trajectory
The most significant medium-term threat to US macroeconomic stability is the path of federal public debt. With gross national debt exceeding 120% of GDP and annual federal deficits running between 5% and 7% of GDP, the US fiscal baseline faces increasing structural pressure.
As older legacy low-yield Treasury bonds mature, they are refinanced at higher prevailing interest rates. According to IMF fiscal monitor assessments, federal net interest payments are absorbing an expanding share of total fiscal revenue, crowding out discretionary spending and narrowing the government’s capacity to deploy counter-cyclical fiscal stimulus during future downturns.
2. Commercial Real Estate (CRE) & Banking Sector Realignment
The structural transformation toward hybrid work models has permanently altered office space utilization across major US metropolitan areas. Regional and community banks, which hold a disproportionate share of commercial real estate debt, face ongoing balance-sheet pressure as legacy office loans mature and require refinancing at lower property valuations and higher interest rates. While systemic money-center banks remain well-capitalized, localized credit tightening from regional lenders presents a headwind for small-and-medium enterprise (SME) borrowing.
High-Outperformance Sector Matrix (2026–2030)
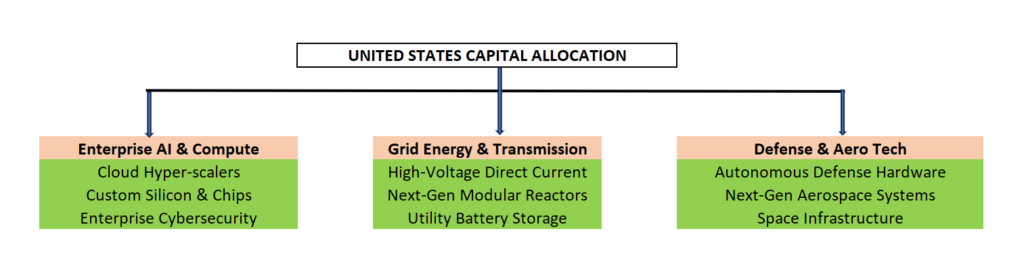
- Enterprise AI, Cloud Compute, & Cybersecurity: Companies building enterprise-grade software, AI agents, cloud architectures, and specialized hardware protection layers.
- Next-Generation Energy & Grid Modernization: Power generation utilities, high-voltage electrical equipment makers, small modular nuclear reactor (SMR) developers, and energy storage systems catering to exponential data center energy demands.
- Advanced Defense Technology & Aerospace: Autonomous systems, satellite networks, hypersonic defense, and advanced materials supplying both domestic security needs and global allied demand.
Strategic Summary for Global Investors & Executives
The United States through 2030 remains the ultimate high-volume, high-yield destination for institutional capital. While fiscal debt risks require long-term monitoring, the immediate 5-year outlook is defined by strong technology-driven productivity, resilient private consumption, and unmatched market liquidity. For global corporations and institutional allocators, exposure to the US economy remains an indispensable pillar of long-term growth strategy.
Top 65 Largest Economies in the World for 2027
Top 10 Largest Economies by 2030: IMF & World Bank GDP Projections for Global Powerhouses

U.S.- Canada Trade Talks Collapse; Carney Says Retaliatory Tariffs Begin September 8

Flock Cameras and the Future of Public Security

AI Infrastructure Boom Hits Physical Limits: Power, Financing, and Supply Chain Strain

Armanino adds Strategic Accounting Outsourced Solutions

New 2023 K-1 instructions stir the CAMT pot for partnerships and corporations

Tax Strategy: Employee Retention Credit update
-

 Stock News1 week ago
Nvidia Earnings Preview: What Wall Street Expects From the AI Bellwether’s Q2 Report
-

 Accounting1 week ago
SEC’s Semiannual Reporting Proposal Faces Investor Pushback: What CFOs Need to Know
-

 Stock News1 week ago
Nvidia Q2 FY2027 Earnings beats Wall Street Expectation with Record $96.2 Billion Revenue
-

 Finance1 week ago
Treasury Bond Volatility Forces Bessent to Double Debt Buyback Size as Yields Swing
-
 Technology5 days ago
AI Infrastructure Boom Hits Physical Limits: Power, Financing, and Supply Chain Strain
-
 Technology2 days ago
Flock Cameras and the Future of Public Security
-
 Economics2 days ago
U.S.- Canada Trade Talks Collapse; Carney Says Retaliatory Tariffs Begin September 8