
Economics
America’s immigration policies are failing


Your browser does not support the <audio> element.
SO YOU WANT to come to America. Venezuela, your home country, is suffering under Nicolás Maduro’s violent kleptocracy. What to do? Good luck getting a green card: employers won’t bother sponsoring a low-skilled worker like you, and you have no immediate family in America to vouch for you. Your WhatsApp is filled with news of friends who have crossed America’s southern border. You decide to follow them and, after a hellish trip, make it to the Rio Grande. You could try to slip across undetected—about 600,000 “gotaways” managed it last year. Or you can tell the border agents who intercept you that you want asylum. Odds are that they will release you with a court date scheduled in several months’ time, kickstarting a process that may take years. Welcome to America.
In November 2023 nearly 250,000 migrants crossed the southern border. The surge—and the perception that America’s borders are open—is a giant political liability for President Joe Biden. Just 27% of Americans tell pollsters that they approve of his handling of the border. More than twice as many trust Donald Trump on the issue. The fact that surging migration over the southern border could cost Mr Biden the election in November has made the problem trickier to solve. Wrangling over a deal to fund Ukraine in exchange for tighter border security and asylum limits has dragged on for months. Although Senate leaders say an agreement is close, some Republicans—reportedly including Mr Trump—seem to want the border chaos to fester, to better beat Mr Biden over the head with it during the election campaign.
Several factors explain the surge: violence and instability around the globe; plentiful job openings in America; the accurate perception that Mr Biden is more welcoming than his predecessor; and cumbersome, limited pathways to come legally. An overwhelmed border apparatus also invites more crossings, notes David Bier of the Cato Institute, a think-tank. When people hear that they are unlikely to be detained and deported, more try their luck.
Decades of neglect and partisan rancour have crippled America’s immigration system and created a situation where immigrants view asylum-seeking as the surest way to get into the country, rather than a long-shot attempt. Congress last made meaningful reform to immigration law in 1990. Comprehensive, bipartisan reform has seemed close several times since, only to fall apart in the end. In 2006, 2007 and 2013 bipartisan Senate bills included a path to citizenship for undocumented immigrants, more visas for workers and stricter enforcement at the border. In recent years Democrats have largely been animated by the desire to protect daca recipients, immigrants who were brought to America as children, from deportation.
Mr Trump’s candidacy upended the politics of immigration. When he launched his campaign in 2015, the number of migrants apprehended nationwide was at its lowest level since 1971. That fact did not, of course, stop Mr Trump from declaring that migrants threatened the American way of life. (“They’re bringing drugs. They’re bringing crime. They’re rapists. And some, I assume, are good people.”) In 2019 irregular entries at the southern border jumped. Mr Trump saw detention as a means of deterrence and made some migrants with pending asylum claims wait in Mexico. At one time during his presidency nearly 57,000 people were detained. The surge was so great that even Mr Trump released a quarter of migrants into the country immediately with a notice to appear (NTA) in immigration court.
Borderline, personalities, disorder
Mr Biden reduced detentions—the number in custody today is around 38,000—and scrapped the requirement to remain in Mexico. He has tried less effective deterrents. His administration wants to steer migrants towards ports of entry where they arrive for appointments made via a smartphone app. Most are admitted with permission to stay for a year or two. By contrast people caught crossing illegally are presumed ineligible for asylum, with a few narrow exceptions, and quickly deported.

At least that is how it is supposed to work. In reality most migrants who cross illegally are still being released into the country, and irregular arrivals far exceed those at official crossings. Once on American soil a migrant can request asylum, which involves a screening with an asylum officer. Because of Mr Biden’s reluctance to pursue detention and an insufficient number of asylum officers, in November seven in ten were handed an NTA and sent on their way.
Last year the Biden administration also began granting parole to up to 30,000 Cubans, Haitians, Nicaraguans and Venezuelans each month, if applicants identified a financial sponsor in America. Again the goal was to make flows more orderly and decrease illegal arrivals. Permission to stay lasts two years but can be revoked at any time. Illegal crossings by Haitians, Nicaraguans and Cubans plummeted. But Venezuelans, who are less likely to have social ties to America, continue to enter illegally. “Most of the Venezuelans arriving now don’t have family, friends, relatives,” says Theresa Cardinal Brown, who served in the Department for Homeland Security in the Bush and Obama administrations.
Once across the border, migrants head to cities. Shelter systems in New York City, Chicago and Denver are overwhelmed and their mayors want Mr Biden’s help. This is partly the doing of Greg Abbott, the Republican governor of Texas, who is busing migrants to Democratic-run cities. But big cities are also natural magnets for migrants.
With an NTA in hand, new arrivals enter the court system, where the backlog is growing faster than judges can keep up. Cases in immigration court surpassed 3m in November. It takes more than four years on average just to get an initial asylum hearing. Doubling the number of judges would clear the backlog—but only by 2032, according to an estimate from the Congressional Research Service.
Half of asylum cases are denied, and decisions are inconsistent. One judge in Houston denied 95% of her asylum cases last year; another in San Francisco denied just 1% of hers. But the immense wait, low chance of detention and the prospect of work in America encourage migrants with a weak claim to cross the border. Prioritising the most recent arrivals’ cases would reduce this incentive, notes Stephen Yale-Loehr of Cornell Law School. A long journey seems less worth it if the reward is deportation rather than an NTA.
The looming election, Mr Trump’s perceived strength on border issues and Mr Biden’s desire to arm Ukraine mean that the president wants to make a deal. His openness to tougher border enforcement is also no doubt fuelled by Americans’ rightward turn on immigration. Polling from YouGov suggests that more Americans favour building a southern border wall than don’t. Even 32% of Democrats now say they support the idea, up from 20% in 2022.
Whether the House and the Senate can agree on reform is questionable. A deal may include funding for more Border Patrol agents, the ability to shut down migrant intake if encounters reach a certain level, a higher bar for migrants to pass their interview—so that they are not released into the country unless they are likely to actually receive asylum—and limits on parole. Any changes to asylum rules will almost certainly be challenged in the courts.
But House Republicans have waffled, often insisting that they would accept nothing other than HR2, a hardline immigration bill passed along party lines last year that would be dead on arrival in the Senate. On the left, progressives do not want to tighten access to asylum. Both groups should beware. A new poll from The Economist and YouGov suggests that a plurality of Americans want Congress to pass a bill that both funds Ukraine and restricts asylum. The politicians should not ignore their voters. ■
Stay on top of American politics with Checks and Balance, our weekly subscriber-only newsletter, which examines the state of American democracy and the issues that matter to voters.













Economics
U.S. National Debt Surpasses $40 Trillion for the First Time: What It Means for the Economy



Executive Summary & Core Macro Outlook
The United States enters the 2026–2030 macroeconomic window as the unquestioned heavyweight of nominal economic output, retaining its status as the primary engine of global financial liquidity, private enterprise innovation, and high-margin technological deployment. According to multi-year projections from the International Monetary Fund (IMF) World Economic Outlook and complementary datasets from the World Bank, the US nominal Gross Domestic Product (GDP) is projected to reach $32.38 trillion by 2026, accounting for approximately 25% of global nominal output and roughly 14.5% of world GDP measured at Purchasing Power Parity (PPP).
Unlike many of its advanced-economy peers across Western Europe and East Asia—which are grappling with acute demographic contraction and structural energy shocks—the United States demonstrates remarkable macroeconomic resilience. The IMF projects a real GDP Compound Annual Growth Rate (CAGR) of 2.1% to 2.3% through 2030. This expansion is sustained by three structural anchors: unmatched capital depth driving massive private-sector investment in Artificial Intelligence (AI) infrastructure, complete energy independence as a net exporter of hydrocarbons and liquefied natural gas (LNG), and high labor productivity gains that cushion the economy against rising debt-servicing costs.
Macroeconomic Data Matrix (2026–2030 Projections)
| Economic Metric | IMF / World Bank Baseline (2026–2030) | Global Benchmark & Context |
| Nominal GDP (2026 Projection) | ~$32.38 Trillion | Rank #1 Globally |
| GDP at Purchasing Power Parity (PPP) | ~$32.40 Trillion | Rank #2 Globally (Behind China’s ~$38.5T PPP) |
| Projected Real GDP CAGR (2026–2030) | 2.1% – 2.3% | Top decile among G7 advanced economies |
| Gross Public Debt (% of GDP) | ~122.5% – 128.0% | Structural fiscal deficit trajectory |
| Core Inflation Rate (PCE Target) | Stabilizing at 2.0% – 2.2% | Federal Reserve inflation target alignment |
| Current Account Balance (% of GDP) | -2.8% to -3.2% | Persistent capital import & reserve currency demand |
Deep Structural Growth Drivers
1. The AI Infrastructure Hyper-Cycle & TFP Expansion
The defining growth catalyst for the US economy over the 2026–2030 horizon is the unprecedented scale of private capital expenditure (Capex) poured into artificial intelligence infrastructure, enterprise software integration, and advanced computing hardware.
Major technology mega-caps and private equity funds are directing hundreds of billions of dollars annually into hyper-scale data centers, domestic semiconductor fabrication, high-voltage electrical grid upgrades, and AI-driven workflow platforms. According to World Bank economic research, technological adoption across American service and manufacturing sectors is driving a notable uptick in Total Factor Productivity (TFP). This productivity surge allows US companies to expand profit margins and output even in an environment characterized by higher structural real interest rates and tight skilled-labor markets.
2. Deep Capital Markets and Private Sector Liquidity
The structural backbone of US economic outperformance remains its financial system. US capital markets represent over 40% of global equity market capitalization and a vast majority of global venture capital and private credit assets.
This liquidity creates an efficient mechanism for capital allocation: high-potential emerging industries (such as quantum computing, synthetic biology, and advanced defense technology) receive early-stage funding at a scale that no other national market can match. When global monetary conditions tighten, global capital flees toward safety and yield, reinforcing US capital depth and lowering the relative cost of equity capital for American corporations.
3. Net Energy Independence & Industrial Cost Advantages
Unlike industrial hubs in Germany, Japan, or South Korea—which remain highly vulnerable to volatile sea-lane logistics and imported fuel price spikes—the United States operates as a major net exporter of petroleum, natural gas, and refined chemical products.
Access to abundant, cheap domestic natural gas provides US heavy industry, advanced manufacturing, and electricity-hungry data centers with a persistent structural cost advantage. Furthermore, federal policy frameworks (including the CHIPS and Science Act and clean energy tax provisions) continue to catalyze domestic private manufacturing investment, re-shoring high-value supply chains from East Asia back to the American Sunbelt and Midwest.
Macroeconomic Vulnerabilities & Downside Risks
1. Structural Sovereign Debt Trajectory
The most significant medium-term threat to US macroeconomic stability is the path of federal public debt. With gross national debt exceeding 120% of GDP and annual federal deficits running between 5% and 7% of GDP, the US fiscal baseline faces increasing structural pressure.
As older legacy low-yield Treasury bonds mature, they are refinanced at higher prevailing interest rates. According to IMF fiscal monitor assessments, federal net interest payments are absorbing an expanding share of total fiscal revenue, crowding out discretionary spending and narrowing the government’s capacity to deploy counter-cyclical fiscal stimulus during future downturns.
2. Commercial Real Estate (CRE) & Banking Sector Realignment
The structural transformation toward hybrid work models has permanently altered office space utilization across major US metropolitan areas. Regional and community banks, which hold a disproportionate share of commercial real estate debt, face ongoing balance-sheet pressure as legacy office loans mature and require refinancing at lower property valuations and higher interest rates. While systemic money-center banks remain well-capitalized, localized credit tightening from regional lenders presents a headwind for small-and-medium enterprise (SME) borrowing.
High-Outperformance Sector Matrix (2026–2030)
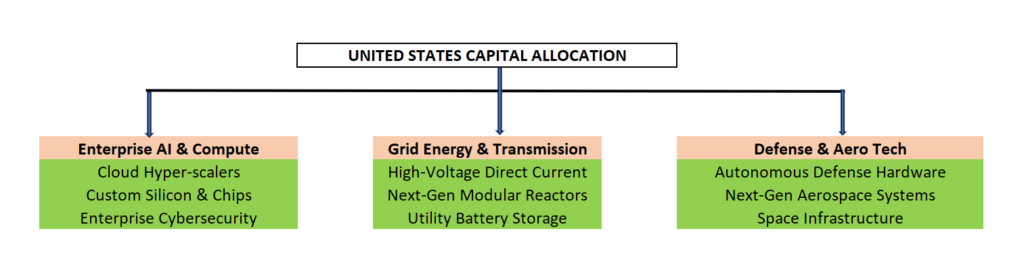
- Enterprise AI, Cloud Compute, & Cybersecurity: Companies building enterprise-grade software, AI agents, cloud architectures, and specialized hardware protection layers.
- Next-Generation Energy & Grid Modernization: Power generation utilities, high-voltage electrical equipment makers, small modular nuclear reactor (SMR) developers, and energy storage systems catering to exponential data center energy demands.
- Advanced Defense Technology & Aerospace: Autonomous systems, satellite networks, hypersonic defense, and advanced materials supplying both domestic security needs and global allied demand.
Strategic Summary for Global Investors & Executives
The United States through 2030 remains the ultimate high-volume, high-yield destination for institutional capital. While fiscal debt risks require long-term monitoring, the immediate 5-year outlook is defined by strong technology-driven productivity, resilient private consumption, and unmatched market liquidity. For global corporations and institutional allocators, exposure to the US economy remains an indispensable pillar of long-term growth strategy.
Top 65 Largest Economies in the World for 2027
Top 10 Largest Economies by 2030: IMF & World Bank GDP Projections for Global Powerhouses

U.S.- Canada Trade Talks Collapse; Carney Says Retaliatory Tariffs Begin September 8

Flock Cameras and the Future of Public Security

AI Infrastructure Boom Hits Physical Limits: Power, Financing, and Supply Chain Strain

Armanino adds Strategic Accounting Outsourced Solutions

New 2023 K-1 instructions stir the CAMT pot for partnerships and corporations

Tax Strategy: Employee Retention Credit update
-

 Stock News1 week ago
Nvidia Earnings Preview: What Wall Street Expects From the AI Bellwether’s Q2 Report
-

 Accounting1 week ago
SEC’s Semiannual Reporting Proposal Faces Investor Pushback: What CFOs Need to Know
-

 Finance1 week ago
Treasury Bond Volatility Forces Bessent to Double Debt Buyback Size as Yields Swing
-

 Stock News1 week ago
Nvidia Q2 FY2027 Earnings beats Wall Street Expectation with Record $96.2 Billion Revenue
-
 Technology4 days ago
AI Infrastructure Boom Hits Physical Limits: Power, Financing, and Supply Chain Strain
-
 Economics2 days ago
U.S.- Canada Trade Talks Collapse; Carney Says Retaliatory Tariffs Begin September 8
-
 Technology2 days ago
Flock Cameras and the Future of Public Security