
Economics
Both chambers of America’s Congress may flip in November


Your browser does not support the <audio> element.
AMERICANS WILL elect 471 federal officials in November: 435 members of the House of Representatives, 34 senators, a vice-president and a president. These contests are overshadowed by the impending rematch between President Joe Biden and Donald Trump, his predecessor, which will be pitched as a struggle between democracy and autocracy (and amplified by a projected $3bn in campaign spending). Seven months of this promises to be wearing.
Cast your eye down the ballot, however, and something exotic is in the offing. At the moment, Washington is divided by the thinnest of margins. Democrats control the Senate by just two seats out of 100. Republicans control the House of Representatives by five out of 435 (a margin that will shrink to four once Mike Gallagher of Wisconsin retires next month).
After the election, control of both chambers could flip. In the Senate, the seats contested this year are in extremely favourable states for Republicans. In the House, by contrast, Democrats campaigning against the chaos of Republican leadership may wrest back control. A double flip would be quite a feat of political gymnastics: it has never happened before.
Senate terms last six years, and only one-third are contested every two years. The mix this year is unkind to Democrats. Joe Manchin, the West Virginia senator who managed to remain the Democratic representative of his Trump-loving state, is retiring. His seat will almost certainly be filled by a Republican, leaving the starting-point for the race at, in essence, 50-50.
Of the seven competitive Senate races this cycle, all are now held by Democrats. Five are in presidential battleground states (Arizona, Michigan, Nevada, Pennsylvania and Wisconsin). They are winnable by Democrats, but none comfortably (see chart). In Montana and Ohio Mr Biden is likely to lose, but the incumbent Democratic senators, Jon Tester and Sherrod Brown, must prevail if the party is to retain control of the chamber. They are the last remaining Democrats holding statewide office in their respective states. Adding to the Democrats’ headaches, Larry Hogan, a popular Republican ex-governor of ordinarily deep-Democratic Maryland, plans to run for its Senate seat.

Republican incumbents, meanwhile, look comfortable. The two that Democrats have the slightest chance of upsetting are Ted Cruz of Texas and Rick Scott of Florida—neither of whom represents states that Mr Biden will be seriously contesting. Overall, then, the maths look troubling for Democrats. They will need to play perfect defence to get to a 50-50 Senate (and hope that Kamala Harris remains vice-president to break ties in their favour).
True, the Democrats managed this feat in the midterms of 2022 (actually gaining one seat, in Pennsylvania). They expect to retain their fundraising advantages. And the candidate-quality issues that hurt Republicans in previous elections may recur. In Arizona, for example, Kari Lake, an election-denying demagogue who in 2022 lost her bid for governor against a weak Democratic challenger, will probably be the party’s Senate candidate. In Pennsylvania Dave McCormick, the presumptive Republican nominee who lost an expensive Senate primary in 2022 to a celebrity doctor, Mehmet Oz, is dogged by allegations of carpet-bagging over his private-jet travel to his mansion in Connecticut.
The House elections are not so tilted against the Republicans as the Senate elections are against the Democrats. But Democrats have a more credible case for taking the chamber than the Republicans do for keeping it, for a number of reasons.
First, Republican stewardship of the House has been chaotic, even by the low standards of Congress. Last year, for the first time in American history, Republican hardliners deposed their speaker. Last week one of their ranks, Marjorie Taylor Greene, introduced a motion to depose the current speaker. More ordinary forces also militate against Republicans. Democrats are expected to outspend them. And there are over a dozen Republicans in districts that voted for Mr Biden; there are only five Democrats in Trump-friendly districts.

The possible flip-flopping of the chambers may seem odd when American politics are so nationalised and polarised. Split-ticket voting—in which people vote for presidential candidates of one party and congressional candidates of another—has gone from common to exceptional. In roughly one-third of the Senate races held in the presidential-election years of 1992, 1996 and 2000, voters opted for a presidential candidate of one party and a senator of the other. In 2016 there were no such cases. And in the 33 elections held in 2020 the sole exception was in Maine.
Split congressional districts have also declined precipitously. Before 2000 well over 100 districts typically had representatives belonging to a different party from the voters’ presidential preference. By 2020 this had declined to a record low of 16.
But as American politics have calcified into two mutually loathing teams of nearly equal size, legislative majorities that were once enduring have become narrow and unstable. Between 1932 and 1994, Democrats controlled the House for all but four years. Since then the chamber has flipped party control five times. Minor fluctuations—small shifts in turnout, the entry of a third-party candidate—can be decisive.
A double flip would matter for more than just novelty. Republican control of the Senate would mean that Mr Trump, if he regains the White House, would have a far easier time confirming his most outlandish potential nominees. Mr Biden, if re-elected, could find that his nominees to fill judicial vacancies were refused.
Republican senators are, for the moment, more internationalist than their House colleagues, so aid for Ukraine could pass through a differently divided government. But on the whole, divided government tends to be inimical to serious legislating—as experienced in the tug-of-war between President Barack Obama and the Republican-controlled Senate after 2015.
The competition for Capitol Hill has not yet attracted a great deal of public interest. Perhaps it should. For all the attention that Americans pay to the question of their next president, they devote surprisingly little to whether or not he will be able to do much from his perch. ■













Economics
U.S. National Debt Surpasses $40 Trillion for the First Time: What It Means for the Economy



Executive Summary & Core Macro Outlook
The United States enters the 2026–2030 macroeconomic window as the unquestioned heavyweight of nominal economic output, retaining its status as the primary engine of global financial liquidity, private enterprise innovation, and high-margin technological deployment. According to multi-year projections from the International Monetary Fund (IMF) World Economic Outlook and complementary datasets from the World Bank, the US nominal Gross Domestic Product (GDP) is projected to reach $32.38 trillion by 2026, accounting for approximately 25% of global nominal output and roughly 14.5% of world GDP measured at Purchasing Power Parity (PPP).
Unlike many of its advanced-economy peers across Western Europe and East Asia—which are grappling with acute demographic contraction and structural energy shocks—the United States demonstrates remarkable macroeconomic resilience. The IMF projects a real GDP Compound Annual Growth Rate (CAGR) of 2.1% to 2.3% through 2030. This expansion is sustained by three structural anchors: unmatched capital depth driving massive private-sector investment in Artificial Intelligence (AI) infrastructure, complete energy independence as a net exporter of hydrocarbons and liquefied natural gas (LNG), and high labor productivity gains that cushion the economy against rising debt-servicing costs.
Macroeconomic Data Matrix (2026–2030 Projections)
| Economic Metric | IMF / World Bank Baseline (2026–2030) | Global Benchmark & Context |
| Nominal GDP (2026 Projection) | ~$32.38 Trillion | Rank #1 Globally |
| GDP at Purchasing Power Parity (PPP) | ~$32.40 Trillion | Rank #2 Globally (Behind China’s ~$38.5T PPP) |
| Projected Real GDP CAGR (2026–2030) | 2.1% – 2.3% | Top decile among G7 advanced economies |
| Gross Public Debt (% of GDP) | ~122.5% – 128.0% | Structural fiscal deficit trajectory |
| Core Inflation Rate (PCE Target) | Stabilizing at 2.0% – 2.2% | Federal Reserve inflation target alignment |
| Current Account Balance (% of GDP) | -2.8% to -3.2% | Persistent capital import & reserve currency demand |
Deep Structural Growth Drivers
1. The AI Infrastructure Hyper-Cycle & TFP Expansion
The defining growth catalyst for the US economy over the 2026–2030 horizon is the unprecedented scale of private capital expenditure (Capex) poured into artificial intelligence infrastructure, enterprise software integration, and advanced computing hardware.
Major technology mega-caps and private equity funds are directing hundreds of billions of dollars annually into hyper-scale data centers, domestic semiconductor fabrication, high-voltage electrical grid upgrades, and AI-driven workflow platforms. According to World Bank economic research, technological adoption across American service and manufacturing sectors is driving a notable uptick in Total Factor Productivity (TFP). This productivity surge allows US companies to expand profit margins and output even in an environment characterized by higher structural real interest rates and tight skilled-labor markets.
2. Deep Capital Markets and Private Sector Liquidity
The structural backbone of US economic outperformance remains its financial system. US capital markets represent over 40% of global equity market capitalization and a vast majority of global venture capital and private credit assets.
This liquidity creates an efficient mechanism for capital allocation: high-potential emerging industries (such as quantum computing, synthetic biology, and advanced defense technology) receive early-stage funding at a scale that no other national market can match. When global monetary conditions tighten, global capital flees toward safety and yield, reinforcing US capital depth and lowering the relative cost of equity capital for American corporations.
3. Net Energy Independence & Industrial Cost Advantages
Unlike industrial hubs in Germany, Japan, or South Korea—which remain highly vulnerable to volatile sea-lane logistics and imported fuel price spikes—the United States operates as a major net exporter of petroleum, natural gas, and refined chemical products.
Access to abundant, cheap domestic natural gas provides US heavy industry, advanced manufacturing, and electricity-hungry data centers with a persistent structural cost advantage. Furthermore, federal policy frameworks (including the CHIPS and Science Act and clean energy tax provisions) continue to catalyze domestic private manufacturing investment, re-shoring high-value supply chains from East Asia back to the American Sunbelt and Midwest.
Macroeconomic Vulnerabilities & Downside Risks
1. Structural Sovereign Debt Trajectory
The most significant medium-term threat to US macroeconomic stability is the path of federal public debt. With gross national debt exceeding 120% of GDP and annual federal deficits running between 5% and 7% of GDP, the US fiscal baseline faces increasing structural pressure.
As older legacy low-yield Treasury bonds mature, they are refinanced at higher prevailing interest rates. According to IMF fiscal monitor assessments, federal net interest payments are absorbing an expanding share of total fiscal revenue, crowding out discretionary spending and narrowing the government’s capacity to deploy counter-cyclical fiscal stimulus during future downturns.
2. Commercial Real Estate (CRE) & Banking Sector Realignment
The structural transformation toward hybrid work models has permanently altered office space utilization across major US metropolitan areas. Regional and community banks, which hold a disproportionate share of commercial real estate debt, face ongoing balance-sheet pressure as legacy office loans mature and require refinancing at lower property valuations and higher interest rates. While systemic money-center banks remain well-capitalized, localized credit tightening from regional lenders presents a headwind for small-and-medium enterprise (SME) borrowing.
High-Outperformance Sector Matrix (2026–2030)
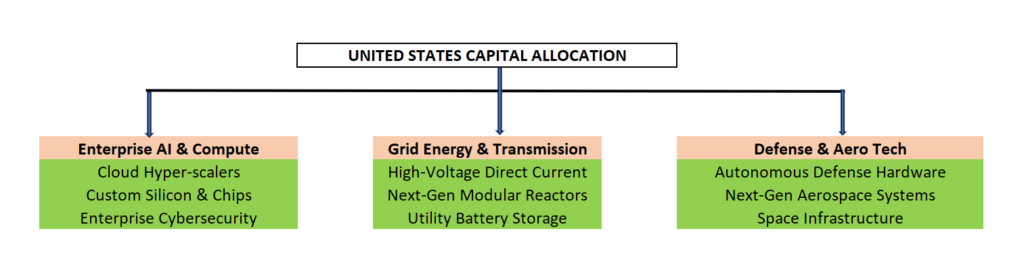
- Enterprise AI, Cloud Compute, & Cybersecurity: Companies building enterprise-grade software, AI agents, cloud architectures, and specialized hardware protection layers.
- Next-Generation Energy & Grid Modernization: Power generation utilities, high-voltage electrical equipment makers, small modular nuclear reactor (SMR) developers, and energy storage systems catering to exponential data center energy demands.
- Advanced Defense Technology & Aerospace: Autonomous systems, satellite networks, hypersonic defense, and advanced materials supplying both domestic security needs and global allied demand.
Strategic Summary for Global Investors & Executives
The United States through 2030 remains the ultimate high-volume, high-yield destination for institutional capital. While fiscal debt risks require long-term monitoring, the immediate 5-year outlook is defined by strong technology-driven productivity, resilient private consumption, and unmatched market liquidity. For global corporations and institutional allocators, exposure to the US economy remains an indispensable pillar of long-term growth strategy.
Top 65 Largest Economies in the World for 2027
Top 10 Largest Economies by 2030: IMF & World Bank GDP Projections for Global Powerhouses

U.S.- Canada Trade Talks Collapse; Carney Says Retaliatory Tariffs Begin September 8

Flock Cameras and the Future of Public Security

AI Infrastructure Boom Hits Physical Limits: Power, Financing, and Supply Chain Strain

Armanino adds Strategic Accounting Outsourced Solutions

New 2023 K-1 instructions stir the CAMT pot for partnerships and corporations

Tax Strategy: Employee Retention Credit update
-

 Stock News1 week ago
Nvidia Earnings Preview: What Wall Street Expects From the AI Bellwether’s Q2 Report
-

 Accounting1 week ago
SEC’s Semiannual Reporting Proposal Faces Investor Pushback: What CFOs Need to Know
-

 Stock News1 week ago
Nvidia Q2 FY2027 Earnings beats Wall Street Expectation with Record $96.2 Billion Revenue
-

 Finance1 week ago
Treasury Bond Volatility Forces Bessent to Double Debt Buyback Size as Yields Swing
-
 Technology5 days ago
AI Infrastructure Boom Hits Physical Limits: Power, Financing, and Supply Chain Strain
-
 Technology2 days ago
Flock Cameras and the Future of Public Security
-
 Economics2 days ago
U.S.- Canada Trade Talks Collapse; Carney Says Retaliatory Tariffs Begin September 8