
Economics
How does Ron DeSantis dropping out change the Republican primary?


Editor’s note (January 21st 2024): This story was updated after Ron DeSantis said he was suspending his campaign for the Republican nomination.
RON DESANTIS’S campaign ended, as it began, on X. His live launch event was meant to show how au fait with the future the Florida governor was. Instead the glitchy launch turned into the equivalent of dad dancing. Mr DeSantis took no such chances with his withdrawal from the Republican primary, which he announced in a video posted on the same platform. As a final act of self-degradation he endorsed Donald Trump, who has been bullying him for months about his height and his table manners.
That leaves just two candidates standing: Mr Trump and Nikki Haley. Ms Haley’s hopes hinge on the tiny state of New Hampshire, which votes on January 23rd. Though only three of the past eight winners of a competitive Republican Iowa caucus have gone on to win their party’s nomination, New Hampshire has voted for six eventual nominees. Ms Haley hopes to become the seventh. Mr DeSantis’s departure is unlikely to make a hard task any easier.
Her campaign is right to bet on New Hampshire. Ms Haley’s base—independent, moderate and college-educated voters—makes up an unusually large share of the state’s primary electorate. But the promise New Hampshire offers is also why Ms Haley finds herself in a bind. Although a triumph in the Granite State could give her a lift, the electorate across the remaining key states in the Republican primary is more religious, less educated and as a result far Trumpier. The coalition she has crafted to be competitive in New Hampshire will be hard, perhaps impossible, to recreate elsewhere.

A Republican non-incumbent candidate has never won both Iowa and New Hampshire in the party’s primary. But judging by the latest polling Donald Trump, ever the disruptor, looks set to make history. He leads Ms Haley in the state by 15 points; Mr DeSantis had sunk to single figures (see chart 1). In a Republican primary marked by candidates fighting for second place (the former president leads nationally by 55 points), the Haley campaign reckons her smaller deficit in New Hampshire is surmountable. A month before the Iowa caucuses Mr Trump’s lead in the state was nearly double what it is today. Her campaign and allied super PACs have bombarded New Hampshire’s airwaves with ads, spending twice as much as Mr Trump and a bit more than three and a half times as much as Mr DeSantis, who finished just above Ms Haley in Iowa on January 15th (chart 2).

Now he is no longer in the race, where will his voters go? The Economist’s YouGov poll, taken earlier in January, asked Republican primary voters about their second preferences. The race may have moved since, and the poll was taken before Vivek Ramaswamy dropped out, but the numbers are still instructive. Among first choice DeSantis voters in that survey, 44% said Mr Trump would be their second choice. Only 24% said they would vote for Ms Haley. The sample is small, so aim off for that. But the reason the sample is small is that there are so few DeSantis voters in the poll.
If Ms Haley wins in New Hampshire it will be in no small part thanks to the state’s open primary rules and, to a lesser extent, a kink in the Democratic primary. Unaffiliated voters, not just Democrats and Republicans, can take part in one of New Hampshire’s primaries. This year some independents will have little choice but to vote in the Republican one because New Hampshire (living up to its state motto “live free or die”) has rendered the Democratic Party’s primary obsolete. In an effort to make the set of states that vote earlier in the primary process more reflective of the Democratic Party’s voters, the Democratic National Committee (DNC) moved the state’s primary to follow or coincide with those of South Carolina and Nevada, which have more non-white voters. But New Hampshire state law requires its primaries to be the first in the country. As a result, the contest on Tuesday is not formally recognised by the DNC, and Joe Biden is not on the ballot.
This is fortunate for Ms Haley. Independents in New Hampshire back her by a 15-point margin. According to poll estimates, they are expected to account for nearly half the state’s primary electorate, compared with 30% in 2016. However, other states with open Republican primaries will have a corresponding Democratic primary to siphon off independents. Such is the case in South Carolina, Ms Haley’s home state. According to a poll taken in early January, although independents there support her by a four-point margin, they make up only an estimated one-quarter of the state’s Republican-primary electorate. And because Mr Trump’s grip on the remaining three-quarters of South Carolina’s electorate is so strong (they back him by three to one), the overall gap between Ms Haley and the former president was a canyonesque 29 points before Mr DeSantis dropped out. For her four-point advantage among independents to outweigh her 41-point deficit among Republicans, independents would need to make up 91% of the South Carolina electorate. They do not.
Just possibly she could win New Hampshire’s Republican primary on the backs of independents, but she cannot win the nomination with this formula. So winning alone is not enough; rather, Ms Haley needs to show marked improvement among the party faithful if her candidacy is to remain viable. She failed to surge among Republicans in Iowa and polling suggests it will be a tall order in New Hampshire, too. According to a Suffolk University poll, nearly half of Ms Haley’s would-be voters there say they are casting their ballot against Donald Trump, rather than in support of her. In contrast, 93% of Mr Trump’s supporters say they are voting for him, not against Ms Haley. MAGA voters’ support seems to be set in granite.■













Economics
U.S. National Debt Surpasses $40 Trillion for the First Time: What It Means for the Economy



Executive Summary & Core Macro Outlook
The United States enters the 2026–2030 macroeconomic window as the unquestioned heavyweight of nominal economic output, retaining its status as the primary engine of global financial liquidity, private enterprise innovation, and high-margin technological deployment. According to multi-year projections from the International Monetary Fund (IMF) World Economic Outlook and complementary datasets from the World Bank, the US nominal Gross Domestic Product (GDP) is projected to reach $32.38 trillion by 2026, accounting for approximately 25% of global nominal output and roughly 14.5% of world GDP measured at Purchasing Power Parity (PPP).
Unlike many of its advanced-economy peers across Western Europe and East Asia—which are grappling with acute demographic contraction and structural energy shocks—the United States demonstrates remarkable macroeconomic resilience. The IMF projects a real GDP Compound Annual Growth Rate (CAGR) of 2.1% to 2.3% through 2030. This expansion is sustained by three structural anchors: unmatched capital depth driving massive private-sector investment in Artificial Intelligence (AI) infrastructure, complete energy independence as a net exporter of hydrocarbons and liquefied natural gas (LNG), and high labor productivity gains that cushion the economy against rising debt-servicing costs.
Macroeconomic Data Matrix (2026–2030 Projections)
| Economic Metric | IMF / World Bank Baseline (2026–2030) | Global Benchmark & Context |
| Nominal GDP (2026 Projection) | ~$32.38 Trillion | Rank #1 Globally |
| GDP at Purchasing Power Parity (PPP) | ~$32.40 Trillion | Rank #2 Globally (Behind China’s ~$38.5T PPP) |
| Projected Real GDP CAGR (2026–2030) | 2.1% – 2.3% | Top decile among G7 advanced economies |
| Gross Public Debt (% of GDP) | ~122.5% – 128.0% | Structural fiscal deficit trajectory |
| Core Inflation Rate (PCE Target) | Stabilizing at 2.0% – 2.2% | Federal Reserve inflation target alignment |
| Current Account Balance (% of GDP) | -2.8% to -3.2% | Persistent capital import & reserve currency demand |
Deep Structural Growth Drivers
1. The AI Infrastructure Hyper-Cycle & TFP Expansion
The defining growth catalyst for the US economy over the 2026–2030 horizon is the unprecedented scale of private capital expenditure (Capex) poured into artificial intelligence infrastructure, enterprise software integration, and advanced computing hardware.
Major technology mega-caps and private equity funds are directing hundreds of billions of dollars annually into hyper-scale data centers, domestic semiconductor fabrication, high-voltage electrical grid upgrades, and AI-driven workflow platforms. According to World Bank economic research, technological adoption across American service and manufacturing sectors is driving a notable uptick in Total Factor Productivity (TFP). This productivity surge allows US companies to expand profit margins and output even in an environment characterized by higher structural real interest rates and tight skilled-labor markets.
2. Deep Capital Markets and Private Sector Liquidity
The structural backbone of US economic outperformance remains its financial system. US capital markets represent over 40% of global equity market capitalization and a vast majority of global venture capital and private credit assets.
This liquidity creates an efficient mechanism for capital allocation: high-potential emerging industries (such as quantum computing, synthetic biology, and advanced defense technology) receive early-stage funding at a scale that no other national market can match. When global monetary conditions tighten, global capital flees toward safety and yield, reinforcing US capital depth and lowering the relative cost of equity capital for American corporations.
3. Net Energy Independence & Industrial Cost Advantages
Unlike industrial hubs in Germany, Japan, or South Korea—which remain highly vulnerable to volatile sea-lane logistics and imported fuel price spikes—the United States operates as a major net exporter of petroleum, natural gas, and refined chemical products.
Access to abundant, cheap domestic natural gas provides US heavy industry, advanced manufacturing, and electricity-hungry data centers with a persistent structural cost advantage. Furthermore, federal policy frameworks (including the CHIPS and Science Act and clean energy tax provisions) continue to catalyze domestic private manufacturing investment, re-shoring high-value supply chains from East Asia back to the American Sunbelt and Midwest.
Macroeconomic Vulnerabilities & Downside Risks
1. Structural Sovereign Debt Trajectory
The most significant medium-term threat to US macroeconomic stability is the path of federal public debt. With gross national debt exceeding 120% of GDP and annual federal deficits running between 5% and 7% of GDP, the US fiscal baseline faces increasing structural pressure.
As older legacy low-yield Treasury bonds mature, they are refinanced at higher prevailing interest rates. According to IMF fiscal monitor assessments, federal net interest payments are absorbing an expanding share of total fiscal revenue, crowding out discretionary spending and narrowing the government’s capacity to deploy counter-cyclical fiscal stimulus during future downturns.
2. Commercial Real Estate (CRE) & Banking Sector Realignment
The structural transformation toward hybrid work models has permanently altered office space utilization across major US metropolitan areas. Regional and community banks, which hold a disproportionate share of commercial real estate debt, face ongoing balance-sheet pressure as legacy office loans mature and require refinancing at lower property valuations and higher interest rates. While systemic money-center banks remain well-capitalized, localized credit tightening from regional lenders presents a headwind for small-and-medium enterprise (SME) borrowing.
High-Outperformance Sector Matrix (2026–2030)
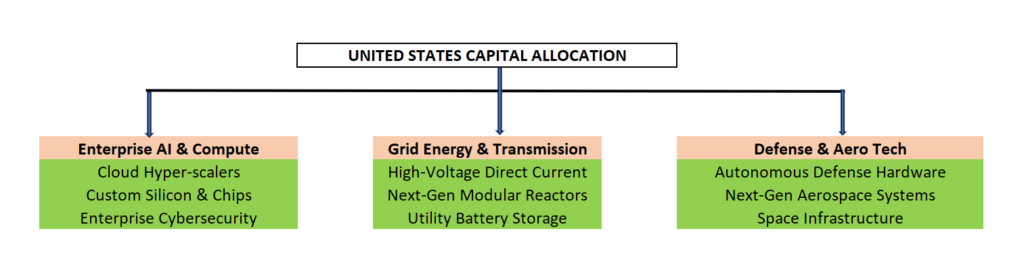
- Enterprise AI, Cloud Compute, & Cybersecurity: Companies building enterprise-grade software, AI agents, cloud architectures, and specialized hardware protection layers.
- Next-Generation Energy & Grid Modernization: Power generation utilities, high-voltage electrical equipment makers, small modular nuclear reactor (SMR) developers, and energy storage systems catering to exponential data center energy demands.
- Advanced Defense Technology & Aerospace: Autonomous systems, satellite networks, hypersonic defense, and advanced materials supplying both domestic security needs and global allied demand.
Strategic Summary for Global Investors & Executives
The United States through 2030 remains the ultimate high-volume, high-yield destination for institutional capital. While fiscal debt risks require long-term monitoring, the immediate 5-year outlook is defined by strong technology-driven productivity, resilient private consumption, and unmatched market liquidity. For global corporations and institutional allocators, exposure to the US economy remains an indispensable pillar of long-term growth strategy.
Top 65 Largest Economies in the World for 2027
Top 10 Largest Economies by 2030: IMF & World Bank GDP Projections for Global Powerhouses

U.S.- Canada Trade Talks Collapse; Carney Says Retaliatory Tariffs Begin September 8

Flock Cameras and the Future of Public Security

AI Infrastructure Boom Hits Physical Limits: Power, Financing, and Supply Chain Strain

Armanino adds Strategic Accounting Outsourced Solutions

New 2023 K-1 instructions stir the CAMT pot for partnerships and corporations

Tax Strategy: Employee Retention Credit update
-

 Stock News1 week ago
Nvidia Q2 FY2027 Earnings beats Wall Street Expectation with Record $96.2 Billion Revenue
-
 Technology5 days ago
AI Infrastructure Boom Hits Physical Limits: Power, Financing, and Supply Chain Strain
-
 Technology3 days ago
Flock Cameras and the Future of Public Security
-
 Economics3 days ago
U.S.- Canada Trade Talks Collapse; Carney Says Retaliatory Tariffs Begin September 8