
Economics
An alternative theory to explain America’s murder spike in 2020


You might call it a new golden age. America’s economy is strong, overdose deaths are falling and crime rates are down. For the second consecutive year murders in America have plummeted. The surge in violence in 2020, which was the deadliest year in over two decades, may now seem like a distant memory to some. Yet for criminologists and policymakers the question of what caused that spike in the first place remains unanswered.
A popular theory, advanced prominently by Heather Mac Donald of the Manhattan Institute, a think-tank, is that it was caused by a “George Floyd effect”. The theory is as follows: after the murder of Floyd by police officers in Minneapolis in 2020, police lost trust in high-crime communities and among African-Americans, leading to lower clearance rates for murders. When people think they will not get caught, they commit more crime. Another version of the Floyd effect thesis holds that police officers, beset by rising public hostility, deliberately pulled back from high-crime neighbourhoods, for fear of being prosecuted for doing their jobs. Either way, protests against police brutality lead directly to more murders, a bitter unintended consequence for the protesters and, perhaps, evidence of the kind of soft liberalism from big-city Democrats that Donald Trump was elected to expunge.
A recent report from the Brookings Institution, a think-tank, advances an alternative theory. Rohit Acharya and Rhett Morris, the report’s authors, argue that the rise in murders began in April 2020, about six weeks before the murder of Mr Floyd. They contend that high unemployment and school closures in poor neighbourhoods, both brought about by covid-19 and the policy response to it, left teenage boys idle. This, not the Floyd effect, was responsible for the murder spike. This would suggest an awful trade-off: those early lockdowns saved many lives, but they also may have resulted in more murders.

Using weekly national homicide data, Messrs Acharya and Morris show that throughout the summer of 2020 murders rose 30% compared with the summer of 2019. Crucially, they do not find an inflection point around the end of May, when Mr Floyd was killed. Across the six weeks preceding his death national weekly murders increased by around 17 murders per week, a rate 70% greater than the same period in 2019. And during the six weeks following his death, murders rose at a similar rate.
What, then, caused this increase? The authors theorise that the economic circumstances of the pandemic are to blame. Criminologists concur that, in general, poverty correlates with crime rates. In Atlanta, 65% of all homicides occur in neighbourhoods where at least 30% of the population lives below the poverty line. Nearly every big American city displays this trend. Poorer neighbourhoods were also disproportionately affected by the pandemic: job losses and high-school dropout rates were far higher. Cities with a greater share of young men living in these conditions saw larger increases in homicides in 2020.
Juveniles typically commit few murders. Though roughly half of murders go unsolved and not all jurisdictions report the age of the murderer, the available data suggest that fewer than 10% of homicides are committed by those under the age of 18. Yet between 2019 and 2020 juveniles accounted for an estimated 15-20% of the overall surge. That seems consistent with the idea that closed schools and idle teenage boys are a big part of the story.
Criminologists tend to be wary of single explanations. “It’s very difficult to come up with a definitive conclusion about what happened in 2020, because so many things changed at the same time”, says Aaron Chalfin, a criminologist at the University of Pennsylvania who was not involved with the Brookings report. He notes that, in the past, unemployment rates have not correlated with murder rates, although that does not necessarily mean no such relationship arose during the pandemic. And teasing out the interactions between variables is trickier still. Were school closures in poorer neighbourhoods responsible for juveniles committing more murders, or was it school closures plus fewer police officers patrolling the streets?
The research, says Neil Gross, a professor of criminology at Colby College (who was also not involved in the study), suggests that the nature of social ties in poor areas matters. Crime is often lower where “people know their neighbours and can look out on the street for errant teenagers and contact their parents”, says Mr Gross. That suggests yet another potential suspect: such neighbourhood watchers were locked down at home. ■
Stay on top of American politics with The US in brief, our daily newsletter with fast analysis of the most important political news, and Checks and Balance, a weekly note from our Lexington columnist that examines the state of American democracy and the issues that matter to voters.













Economics
U.S. National Debt Surpasses $40 Trillion for the First Time: What It Means for the Economy



Executive Summary & Core Macro Outlook
The United States enters the 2026–2030 macroeconomic window as the unquestioned heavyweight of nominal economic output, retaining its status as the primary engine of global financial liquidity, private enterprise innovation, and high-margin technological deployment. According to multi-year projections from the International Monetary Fund (IMF) World Economic Outlook and complementary datasets from the World Bank, the US nominal Gross Domestic Product (GDP) is projected to reach $32.38 trillion by 2026, accounting for approximately 25% of global nominal output and roughly 14.5% of world GDP measured at Purchasing Power Parity (PPP).
Unlike many of its advanced-economy peers across Western Europe and East Asia—which are grappling with acute demographic contraction and structural energy shocks—the United States demonstrates remarkable macroeconomic resilience. The IMF projects a real GDP Compound Annual Growth Rate (CAGR) of 2.1% to 2.3% through 2030. This expansion is sustained by three structural anchors: unmatched capital depth driving massive private-sector investment in Artificial Intelligence (AI) infrastructure, complete energy independence as a net exporter of hydrocarbons and liquefied natural gas (LNG), and high labor productivity gains that cushion the economy against rising debt-servicing costs.
Macroeconomic Data Matrix (2026–2030 Projections)
| Economic Metric | IMF / World Bank Baseline (2026–2030) | Global Benchmark & Context |
| Nominal GDP (2026 Projection) | ~$32.38 Trillion | Rank #1 Globally |
| GDP at Purchasing Power Parity (PPP) | ~$32.40 Trillion | Rank #2 Globally (Behind China’s ~$38.5T PPP) |
| Projected Real GDP CAGR (2026–2030) | 2.1% – 2.3% | Top decile among G7 advanced economies |
| Gross Public Debt (% of GDP) | ~122.5% – 128.0% | Structural fiscal deficit trajectory |
| Core Inflation Rate (PCE Target) | Stabilizing at 2.0% – 2.2% | Federal Reserve inflation target alignment |
| Current Account Balance (% of GDP) | -2.8% to -3.2% | Persistent capital import & reserve currency demand |
Deep Structural Growth Drivers
1. The AI Infrastructure Hyper-Cycle & TFP Expansion
The defining growth catalyst for the US economy over the 2026–2030 horizon is the unprecedented scale of private capital expenditure (Capex) poured into artificial intelligence infrastructure, enterprise software integration, and advanced computing hardware.
Major technology mega-caps and private equity funds are directing hundreds of billions of dollars annually into hyper-scale data centers, domestic semiconductor fabrication, high-voltage electrical grid upgrades, and AI-driven workflow platforms. According to World Bank economic research, technological adoption across American service and manufacturing sectors is driving a notable uptick in Total Factor Productivity (TFP). This productivity surge allows US companies to expand profit margins and output even in an environment characterized by higher structural real interest rates and tight skilled-labor markets.
2. Deep Capital Markets and Private Sector Liquidity
The structural backbone of US economic outperformance remains its financial system. US capital markets represent over 40% of global equity market capitalization and a vast majority of global venture capital and private credit assets.
This liquidity creates an efficient mechanism for capital allocation: high-potential emerging industries (such as quantum computing, synthetic biology, and advanced defense technology) receive early-stage funding at a scale that no other national market can match. When global monetary conditions tighten, global capital flees toward safety and yield, reinforcing US capital depth and lowering the relative cost of equity capital for American corporations.
3. Net Energy Independence & Industrial Cost Advantages
Unlike industrial hubs in Germany, Japan, or South Korea—which remain highly vulnerable to volatile sea-lane logistics and imported fuel price spikes—the United States operates as a major net exporter of petroleum, natural gas, and refined chemical products.
Access to abundant, cheap domestic natural gas provides US heavy industry, advanced manufacturing, and electricity-hungry data centers with a persistent structural cost advantage. Furthermore, federal policy frameworks (including the CHIPS and Science Act and clean energy tax provisions) continue to catalyze domestic private manufacturing investment, re-shoring high-value supply chains from East Asia back to the American Sunbelt and Midwest.
Macroeconomic Vulnerabilities & Downside Risks
1. Structural Sovereign Debt Trajectory
The most significant medium-term threat to US macroeconomic stability is the path of federal public debt. With gross national debt exceeding 120% of GDP and annual federal deficits running between 5% and 7% of GDP, the US fiscal baseline faces increasing structural pressure.
As older legacy low-yield Treasury bonds mature, they are refinanced at higher prevailing interest rates. According to IMF fiscal monitor assessments, federal net interest payments are absorbing an expanding share of total fiscal revenue, crowding out discretionary spending and narrowing the government’s capacity to deploy counter-cyclical fiscal stimulus during future downturns.
2. Commercial Real Estate (CRE) & Banking Sector Realignment
The structural transformation toward hybrid work models has permanently altered office space utilization across major US metropolitan areas. Regional and community banks, which hold a disproportionate share of commercial real estate debt, face ongoing balance-sheet pressure as legacy office loans mature and require refinancing at lower property valuations and higher interest rates. While systemic money-center banks remain well-capitalized, localized credit tightening from regional lenders presents a headwind for small-and-medium enterprise (SME) borrowing.
High-Outperformance Sector Matrix (2026–2030)
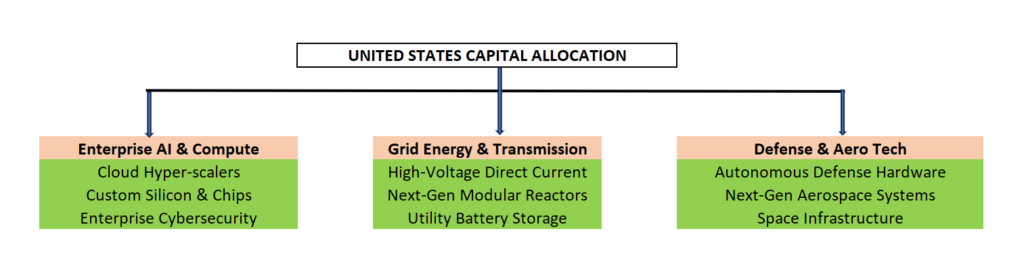
- Enterprise AI, Cloud Compute, & Cybersecurity: Companies building enterprise-grade software, AI agents, cloud architectures, and specialized hardware protection layers.
- Next-Generation Energy & Grid Modernization: Power generation utilities, high-voltage electrical equipment makers, small modular nuclear reactor (SMR) developers, and energy storage systems catering to exponential data center energy demands.
- Advanced Defense Technology & Aerospace: Autonomous systems, satellite networks, hypersonic defense, and advanced materials supplying both domestic security needs and global allied demand.
Strategic Summary for Global Investors & Executives
The United States through 2030 remains the ultimate high-volume, high-yield destination for institutional capital. While fiscal debt risks require long-term monitoring, the immediate 5-year outlook is defined by strong technology-driven productivity, resilient private consumption, and unmatched market liquidity. For global corporations and institutional allocators, exposure to the US economy remains an indispensable pillar of long-term growth strategy.
Top 65 Largest Economies in the World for 2027
Top 10 Largest Economies by 2030: IMF & World Bank GDP Projections for Global Powerhouses

U.S.- Canada Trade Talks Collapse; Carney Says Retaliatory Tariffs Begin September 8

Flock Cameras and the Future of Public Security

AI Infrastructure Boom Hits Physical Limits: Power, Financing, and Supply Chain Strain

Armanino adds Strategic Accounting Outsourced Solutions

New 2023 K-1 instructions stir the CAMT pot for partnerships and corporations

Tax Strategy: Employee Retention Credit update
-

 Stock News1 week ago
Nvidia Earnings Preview: What Wall Street Expects From the AI Bellwether’s Q2 Report
-

 Accounting1 week ago
SEC’s Semiannual Reporting Proposal Faces Investor Pushback: What CFOs Need to Know
-

 Finance1 week ago
Treasury Bond Volatility Forces Bessent to Double Debt Buyback Size as Yields Swing
-

 Stock News1 week ago
Nvidia Q2 FY2027 Earnings beats Wall Street Expectation with Record $96.2 Billion Revenue
-
 Technology4 days ago
AI Infrastructure Boom Hits Physical Limits: Power, Financing, and Supply Chain Strain
-
 Economics2 days ago
U.S.- Canada Trade Talks Collapse; Carney Says Retaliatory Tariffs Begin September 8
-
 Technology2 days ago
Flock Cameras and the Future of Public Security